
More project photos (2)
The problem
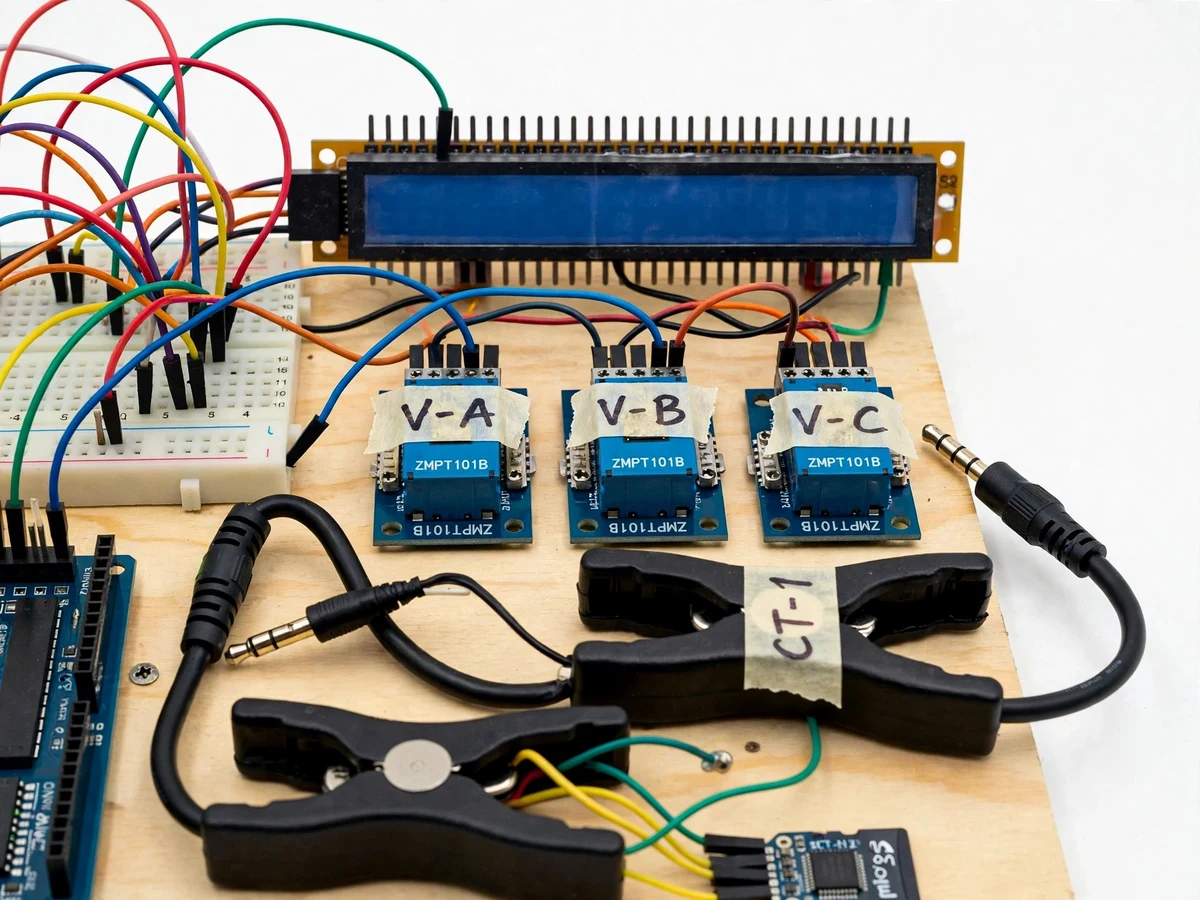
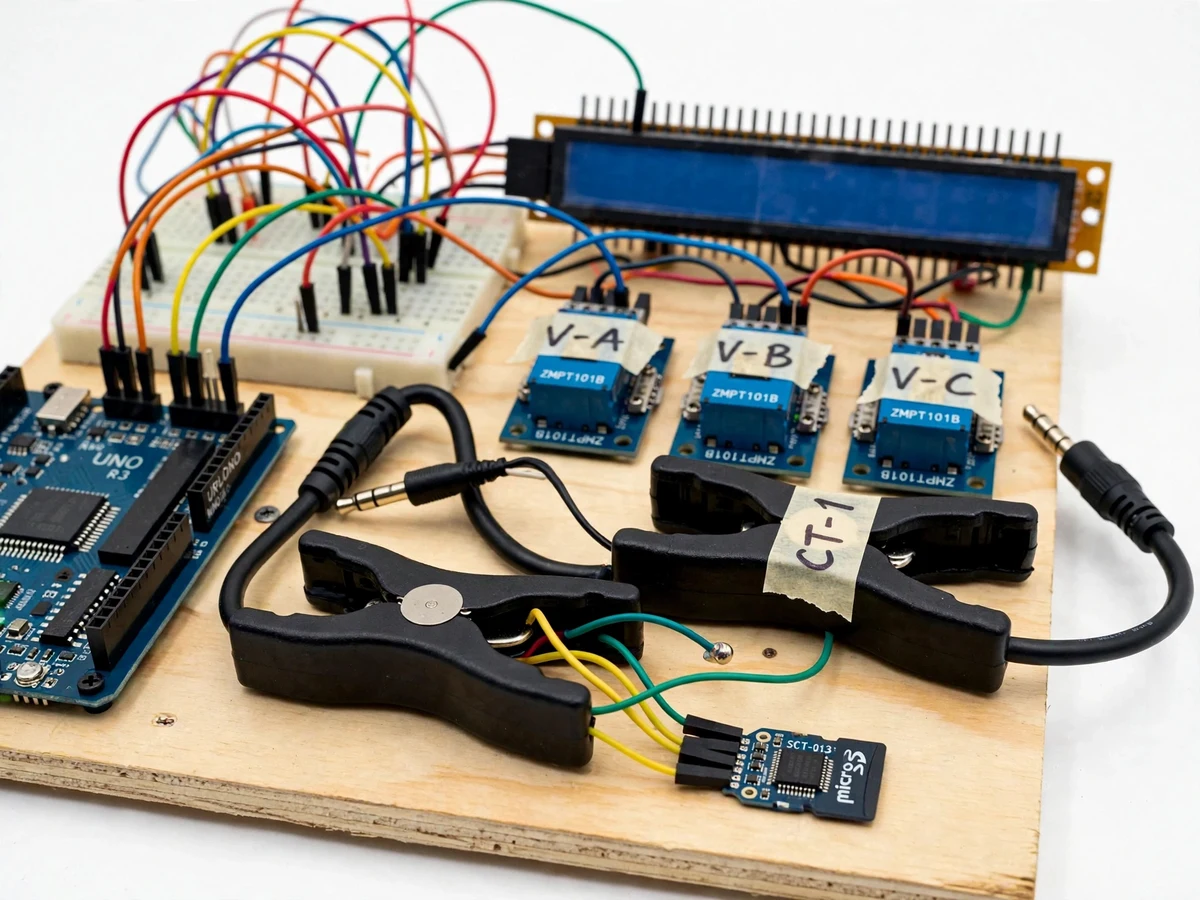
Three-phase supply problems rarely announce themselves at the moment they happen. A motor trips on a Friday evening, a pump controller behaves erratically at shift change, a college lab's three-phase trainer keeps blowing fuses — and by the time someone reaches the panel with a multimeter, the supply looks perfectly normal. What is missing is a record: what the voltage and current on each phase were doing in the minutes and hours before the event. Commercial power-quality analyzers cost lakhs and are locked away in maintenance departments, so students and small workshops never get hands-on time with one. This project closes that gap with a genuinely buildable logger: an Arduino Uno, three ZMPT101B voltage-sensor modules and three SCT-013 clamp current transformers capture all six channels, compute per-phase RMS values once per second, and append them as a timestamped CSV file to a microSD card while a 16x2 LCD shows the live readings. The logged file opens in Excel, so imbalance, sags and overload patterns can be plotted and analyzed honestly.
Three voltage modules feeding one analog input per phase.
Follow the working sequence
How it works
- Each of the three phases feeds a ZMPT101B module through its high-voltage input; the module's conditioned low-voltage output goes to one Arduino analog input per phase.
- Each line conductor passes through one SCT-013 split-core CT; the CT secondary is loaded by a correctly sized burden resistor and conditioned to a second set of three analog inputs.
- Firmware samples each of the six channels for one full 50 Hz mains cycle (approximately 150 samples per channel) and computes RMS voltage and RMS current per phase.
- Once per second the firmware appends a CSV line — elapsed timestamp, VA, VB, VC, IA, IB, IC and voltage imbalance percentage — to the microSD card via the SPI interface.
- The 16x2 LCD rotates every 3 seconds through three screens: phase voltages, phase currents, and imbalance with min/max markers.
- A push-button starts a new log file without re-flashing; an LED blinks on each successful SD write so card problems are visible immediately.
- At build time the student runs the documented calibration procedure: applies a known voltage/current, trims the module potentiometers and the firmware scale factors against a reference multimeter.
Tech stack:
- Arduino Uno (ATmega328P)
- ZMPT101B voltage-sensor modules
- SCT-013 split-core current transformers
- microSD card module (SPI)
- 16x2 character LCD
- Embedded C (Arduino IDE)
- CSV data format for analysis
| Parameter | Value |
|---|---|
| Measured quantities | 3-phase RMS voltage + 3-phase RMS current (6 channels) |
| Voltage input range | 0–250 V AC per phase (design target) |
| Current input range | 0–30 A per phase with SCT-013-030 variant (configurable) |
| Voltage sensor accuracy | ZMPT101B ±1% class (datasheet value) |
| CT accuracy | SCT-013 ±1% class 1 (datasheet value) |
| System accuracy | Approximately ±2% after buyer calibration (design target) |
| Sampling | ~150 samples per channel per 50 Hz cycle (expected) |
| Logging interval | 1 reading per second, CSV (configurable) |
| Storage | microSD up to 32 GB, FAT32 |
| Display | 16×2 character LCD, 3 rotating screens |
| Controller | Arduino Uno, ATmega328P, 10-bit ADC |
| Power supply | 5 V DC adapter for the logger |
| Log format | CSV: timestamp, VA, VB, VC, IA, IB, IC, imbalance % |
Project features
- [Three-phase voltage sensing] Three ZMPT101B sensor modules measure each phase-to-neutral voltage; firmware computes RMS voltage per phase with datasheet-class accuracy after calibration.
- [Three-phase current sensing] Three SCT-013 split-core clamp CTs measure line current without breaking the circuit — they snap around insulated conductors.
- [1-second CSV logging to microSD] Every second, firmware appends one timestamped line (voltages, currents, per-phase imbalance) to a CSV file readable directly in Excel.
- [Live 16x2 LCD readout] The display rotates through voltage, current and imbalance screens so the rig is demo-ready without a laptop attached.
- [Buyer-run calibration procedure] A documented trim procedure against a reference multimeter lets the student calibrate each channel on their own build — honest accuracy, measured by the buyer.
- [Long unattended recording] On a 32 GB card the logger records weeks of 1-second data, suitable for catching intermittent supply events in a lab or workshop.
- [Per-phase imbalance indicator] Firmware computes the percentage spread between the highest and lowest phase voltage, flagging imbalance at a glance on the LCD.
What is included
- Working prototype logger (Arduino Uno, 3× ZMPT101B modules, 3× SCT-013 CTs, microSD module, 16x2 LCD, plywood mounting base)
- Complete firmware with 1-second CSV logging and LCD rotation
- Buyer-run calibration procedure with worked example
- Wiring diagram and component placement guide
- Project report PDF (background, sensor theory, methodology, analysis of sample logs)
- PPT presentation for final review
- Viva Q&A preparation document (CTs, burden resistors, RMS computation, SD logging)
Limitations & prerequisites
- Accuracy is only as good as the buyer's calibration — the kit ships uncalibrated; the procedure must be run against a reference multimeter on the student's build.
- The SCT-013 variant must be chosen for the expected current range; a 100 A variant on a 5 A load gives poor resolution, and swapping variants requires re-sizing the burden resistor.
- The design monitors three phases only; neutral current and neutral-shift detection are out of scope.
- Timestamps are elapsed-time since power-on unless an RTC module is added — not wall-clock time.
- The 1-second logging interval captures RMS trends, not sub-cycle transients; waveform capture and harmonic analysis are future scope.
- SD cards wear with continuous writing; the card should be treated as a consumable and logs backed up regularly.
Frequently Asked Questions
How accurate is the logger?
The ZMPT101B modules and SCT-013 CTs are both datasheet ±1% class parts. After the buyer-run calibration against a reference multimeter, the design target for the assembled logger is approximately ±2% on each channel — honest numbers, verified by the student on their own build rather than claimed in advance.
Do I have to cut any wires to measure current?
No. The SCT-013 sensors are split-core clamps — they open, snap around an insulated conductor and close again. The current is measured magnetically without breaking the circuit, which makes the rig safe to demonstrate and easy to move between test points.
What can I actually do with the logged data?
Each second's readings land in a CSV file that opens in Excel. Students can plot voltage dips, compute daily imbalance, correlate overload trips with current spikes, and compare phases — real measurement work that examiners value in a final viva.
Why not just use a multimeter?
A multimeter shows the present instant only. Intermittent problems — a sag at motor start, imbalance that appears under load — are gone by the time anyone checks. A logger records unattended for weeks, so events are captured with a timestamp instead of guessed at afterwards.
Can it catch fast transients or harmonics?
Not as shipped — it logs one RMS value per second per channel, which shows trends rather than sub-cycle events. Waveform capture and harmonic analysis are documented as future scope in the report.
Is this project suitable for a final-year project?
Yes. This project fits Electrical, Electronics and Instrumentation programs because it is a real measurement instrument: real sensors, real calibration, real logged data and real analysis. The calibration procedure, the RMS computation, the CSV analysis and the viva Q&A give the student genuine technical material to defend, and the prototype is safe to demonstrate live since the CTs clamp around insulated conductors without breaking any circuit. Suitable for B.E./B.Tech final-year projects in Electrical, Electronics and Instrumentation engineering.
Components & software requirements
- Arduino Uno (ATmega328P)
- ZMPT101B voltage-sensor modules
- SCT-013 split-core current transformers
- microSD card module (SPI)
- 16x2 character LCD
- Embedded C (Arduino IDE)
- CSV data format for analysis
Delivery information
Built-to-order project. Delivery timeline is shared after order confirmation based on current queue.
Support terms
Complete documentation, setup guide, and viva preparation included. Support for setup and explanation provided.
Download free synopsis (PDF)
Enter your name and email — the synopsis PDF downloads immediately. We may send occasional project updates; no spam, unsubscribe anytime.