
More project photos (3)
The problem
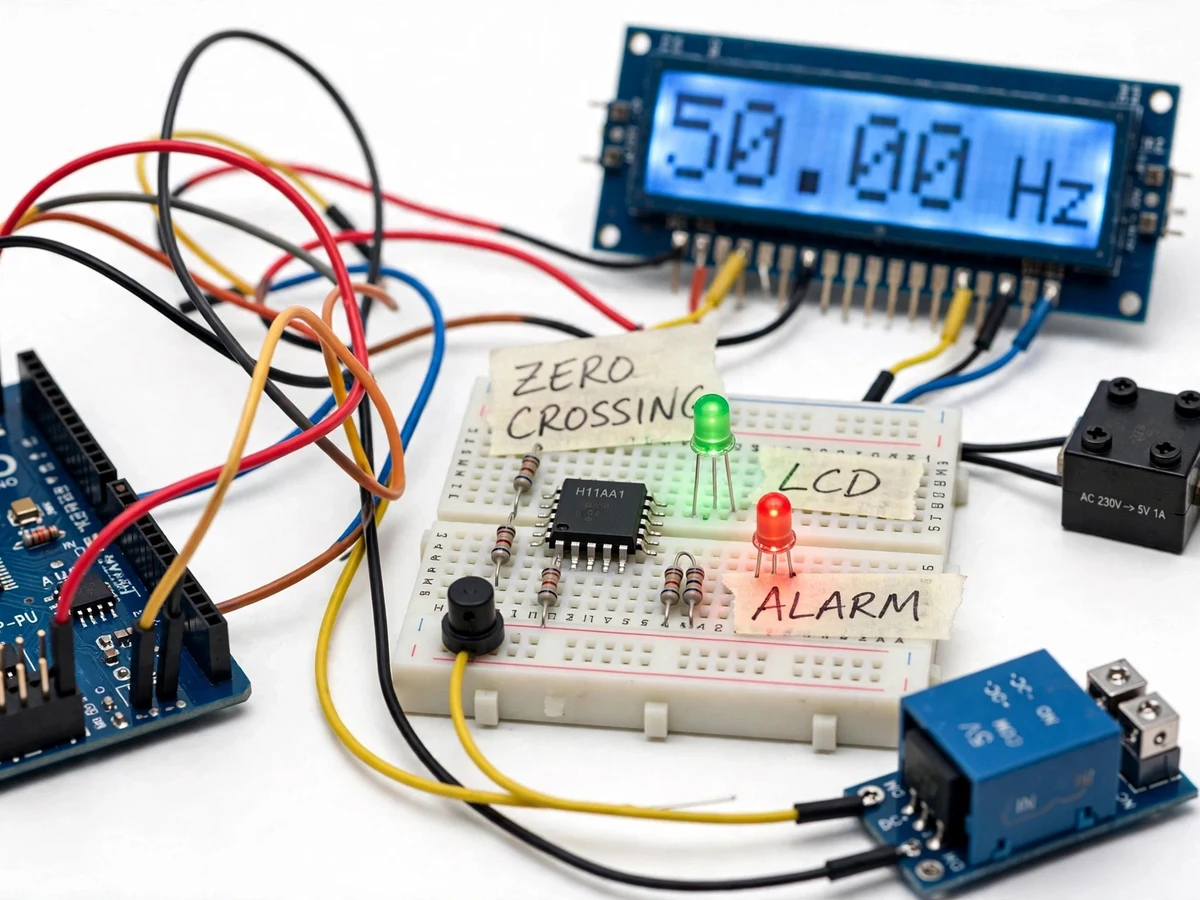
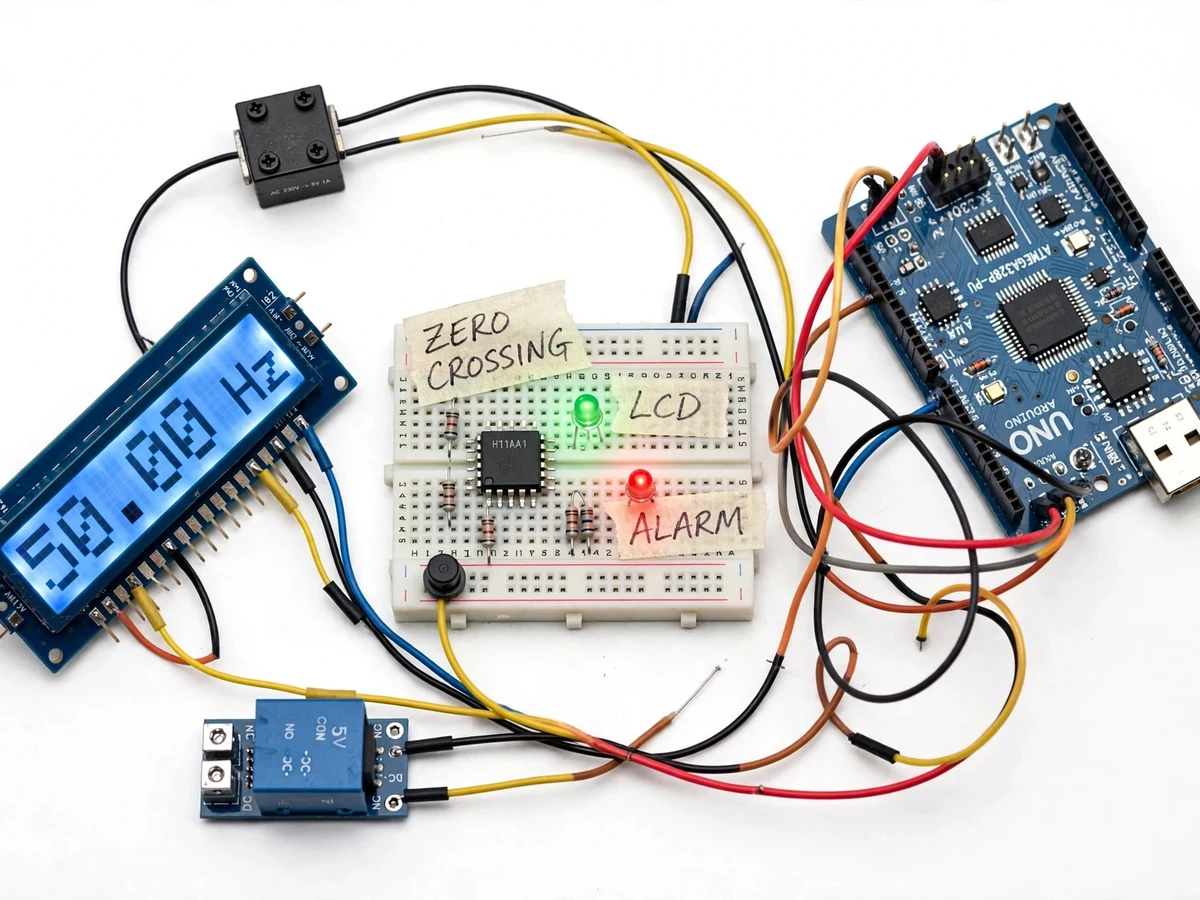
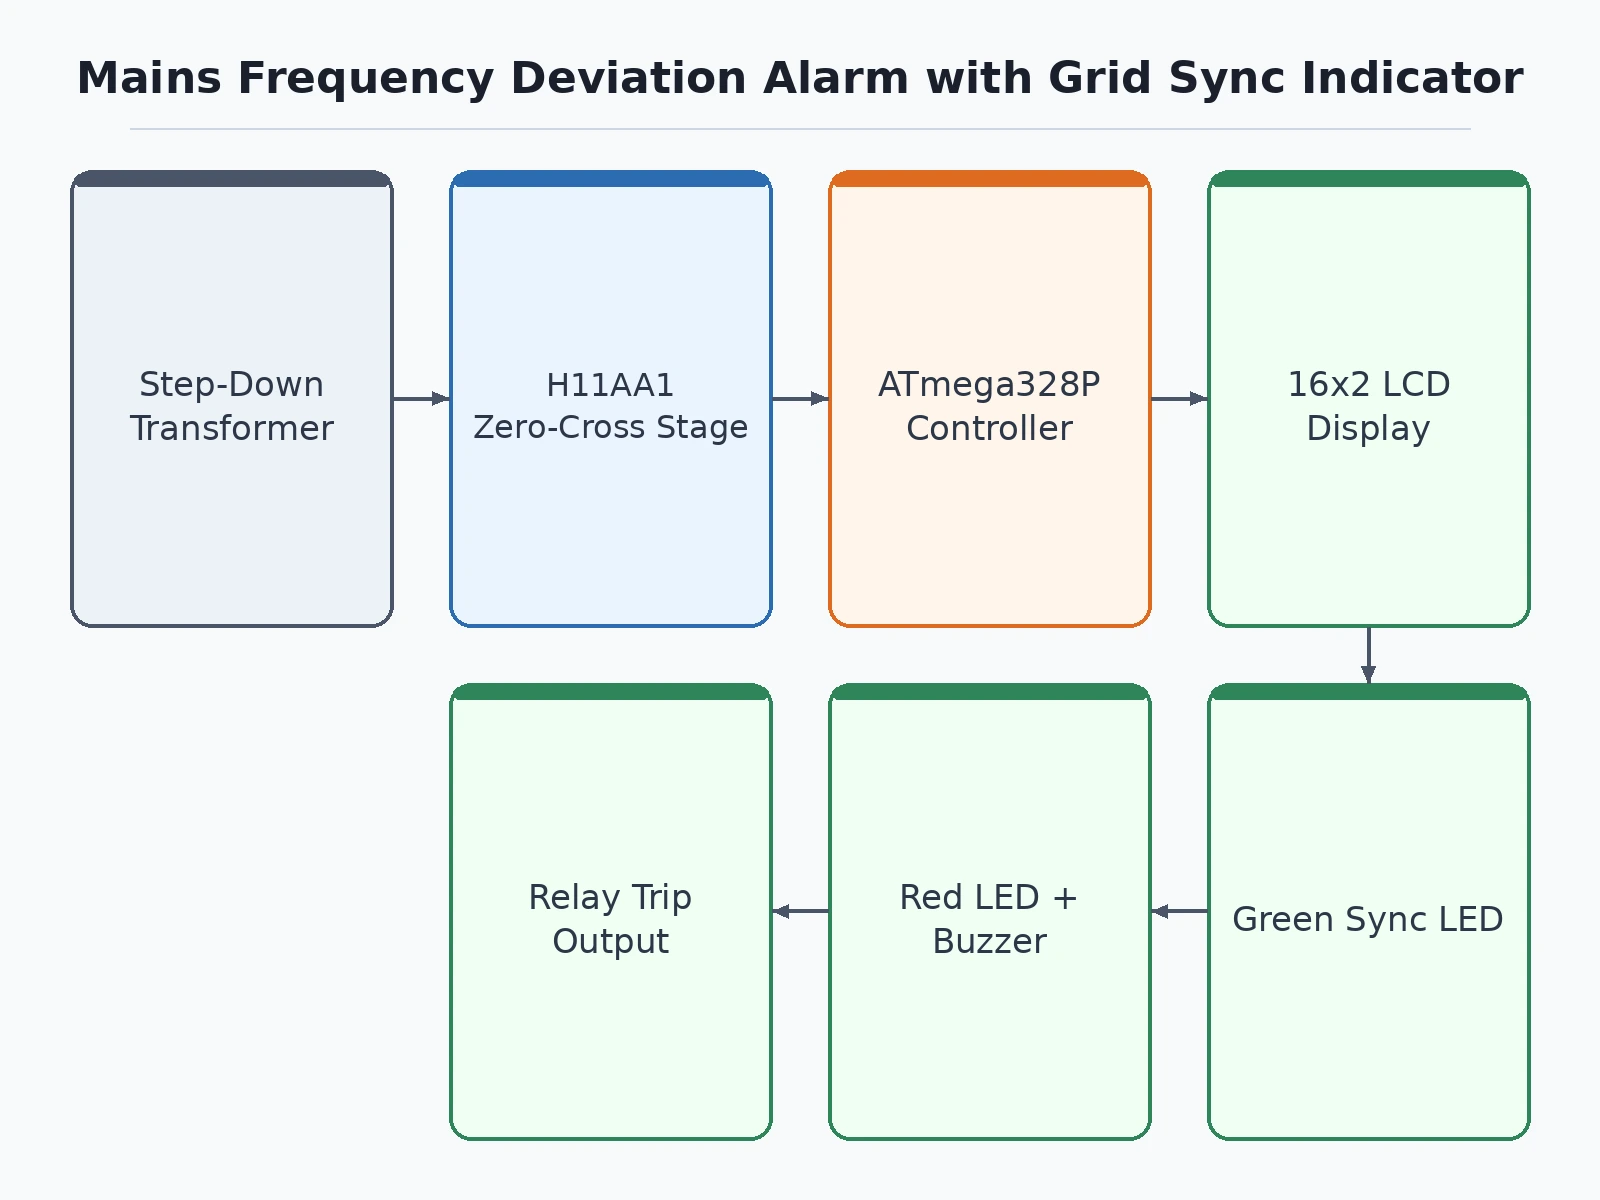
Grid frequency is the most direct indicator of the balance between generation and load — when it drifts, something is wrong somewhere in the system. Students study under/over-frequency protection in power-systems theory, yet rarely measure the quantity themselves: the theory talks about 50 Hz while the student never holds the number in hand. This prototype closes that gap. Mains voltage is stepped down through an isolating transformer into a zero-crossing detector built around the H11AA1 bidirectional optocoupler, which emits one logic pulse per half-cycle while keeping the logic board galvanically isolated. An ATmega328P timestamps the pulses with a hardware interrupt, computes the frequency, and shows it on a 16x2 LCD. A green LED stays lit inside the configured band (design target 49.5–50.5 Hz); deviation trips a red LED, buzzer and optional relay output, while a second LED blinks with the zero crossings as a visible grid-sync heartbeat.
The 230 V, 50 Hz grid supply whose frequency is monitored.
Follow the working sequence
How it works
- A small step-down transformer reduces the 230 V mains to a low-voltage AC signal, providing the first layer of galvanic isolation.
- The low-voltage AC drives the H11AA1 bidirectional optocoupler's inverse-parallel LEDs through current-limiting resistors; the phototransistor side, with a pull-up resistor to the 5 V logic rail, produces one clean logic pulse per mains half-cycle at each zero crossing.
- The pulse feeds the ATmega328P's INT0 interrupt pin (PD2); firmware timestamps each interrupt with the hardware timer and measures the period between successive zero crossings.
- Frequency is computed as the inverse of the averaged period, with a short moving average smoothing jitter; the 16x2 LCD shows the live frequency in Hz and the sync LED blinks with the detected crossings.
- Firmware compares the measured frequency against the configured band: inside the band the green LED stays on; outside it for the confirmation delay, the red LED lights, the buzzer sounds, and the optional relay output energizes.
- When the frequency returns inside the band and stays there for the reset delay, the alarm clears and the system re-arms — demonstrating alarm hysteresis like real protection relays.
Tech stack:
- Arduino Uno (ATmega328P, C/C++ firmware in Arduino IDE)
- H11AA1 bidirectional optocoupler (zero-crossing sensing)
- HD44780-compatible 16x2 character LCD
- Step-down transformer + bridge/rectifier front end (isolated sensing supply)
- 5 V relay module (optional trip output)
- Piezo buzzer + indicator LEDs
- Pull-up and current-limiting resistor network (conditioning stage)
- Breadboard/PCB prototyping with hand-wired build
| Parameter | Value |
|---|---|
| Measured quantity | Mains frequency, nominal 50 Hz (design reference) |
| Sensing method | Zero-crossing pulses via H11AA1 optocoupler |
| Isolation | Transformer + optocoupler, 5300 VRMS (H11AA1 datasheet value) |
| Display resolution | Approximately 0.01 Hz on 16x2 LCD (design target, not a calibrated accuracy claim) |
| Alarm band | 49.5–50.5 Hz default, firmware-configurable (design target) |
| Alarm outputs | Red LED + buzzer (implemented); relay trip output (optional customization) |
| Response behavior | Alarm after configurable confirmation delay (design target: approximately 1–3 s) |
| Controller | ATmega328P, 5 V logic (datasheet operating range 1.8–5.5 V), interrupt-driven timing |
| Sync indicator | LED blinking per zero crossing, approximately 100 pulses/s at 50 Hz (expected) |
| Power | 230 V AC mains input; 5 V DC regulated logic supply (expected) |
Project features
- [Zero-crossing detection with optoisolation] The H11AA1 bidirectional optocoupler (datasheet: 5300 VRMS isolation, min 20% CTR) generates a logic pulse at each mains zero crossing, so the Arduino measures timing without any mains-connected component touching the logic board.
- [Live frequency measurement] Firmware uses an ATmega328P hardware interrupt (INT0 on PD2, datasheet pin mapping) to timestamp consecutive zero crossings and compute mains frequency from the measured period; the result updates continuously on the 16x2 LCD. Resolution is a design target of approximately 0.01 Hz on the display — a display-resolution figure, not a calibrated accuracy claim.
- [Grid-sync indicator LED] A dedicated LED pulses in step with the detected zero crossings, giving a visible heartbeat of mains sync that drops out immediately if the sensing path fails or the mains disappears.
- [Configurable deviation alarm] Green LED lit inside the grid band; red LED plus piezo buzzer when frequency crosses the configurable under/over thresholds (design target default 49.5–50.5 Hz). Thresholds and confirmation delay are firmware constants the student adjusts and documents.
- [Optional relay trip output] A relay module output that can be wired to disconnect a demo load on confirmed deviation, demonstrating the measurement-to-protection chain end to end. Optional customization — not part of the base build.
- [Transformer-based isolated front end] A small step-down transformer feeds the sensing stage, so the prototype presents a double-isolation story (transformer plus optocoupler) for the viva discussion on electrical safety.
- [Buyer-run calibration procedure] The kit includes a step-by-step procedure for the student to verify the frequency readout against a known reference and set the alarm thresholds on their own build, so every number in the report is theirs.
What is included
- Working hardware prototype (step-down transformer front end, H11AA1 zero-crossing stage, Arduino Uno, 16x2 LCD, LEDs, buzzer, relay module)
- Complete firmware source code with commented measurement and alarm logic
- Circuit and wiring documentation with isolation-stage explanation
- Component list with part numbers and ratings
- Step-by-step calibration and threshold-setting procedure for the student's own build
- Project report PDF (background, measurement theory, methodology, calibration log)
- PPT presentation for final review
- Viva Q&A preparation document (zero-crossing detection, frequency measurement, isolation, protection logic)
Limitations & prerequisites
- The frequency readout is a design-target resolution of approximately 0.01 Hz — it is not a calibrated instrument, and the report states the achieved agreement with the reference plainly rather than claiming lab-grade accuracy.
- The prototype measures frequency only; it does not measure voltage, current, harmonics, or power quality.
- Mains wiring is involved: the build, testing and any threshold calibration must happen under qualified supervision, inside an enclosure, with the transformer and optocoupler isolation stages intact — never with exposed mains conductors on a breadboard.
- The optocoupler output edge is relatively slow (datasheet behavior); a Schmitt-trigger or software debounce stage conditions the pulse, and edge jitter limits the ultimate timing precision.
- The default 49.5–50.5 Hz alarm band is a design choice for demonstration, not an official grid-code threshold; the Indian grid's formal operating bands are tighter and are referenced in the report for context.
- The relay trip output is an optional customization for a small demo load — the prototype is not a certified protection relay and must never be presented as one.
Frequently Asked Questions
Which controller and sensing components are used?
An Arduino Uno (ATmega328P) running interrupt-driven firmware, with an H11AA1 bidirectional optocoupler (datasheet: 5300 VRMS isolation, min 20% CTR) as the zero-crossing detector and a step-down transformer feeding the sensing stage. A 16x2 HD44780 LCD shows the live frequency. The build suits a college lab because every stage — sensing, timing, display, alarm — is explainable and testable on its own.
How accurate is the frequency measurement?
The display resolves approximately 0.01 Hz as a design target, but the prototype is not a calibrated instrument — the kit includes a buyer-run procedure to check the readout against a known reference, and the report documents the achieved agreement honestly. It demonstrates the measurement principle, not metrology.
What is the grid-sync indicator?
A dedicated LED that blinks once per detected zero crossing — about 100 blinks per second at 50 Hz — so you can literally see the unit tracking the mains. If the sensing path fails or mains disappears, the heartbeat stops, which is itself a useful fault indication.
Is it safe to work with?
The design keeps mains away from the logic side with two isolation stages — the step-down transformer and the optocoupler — but mains wiring is still involved. Build and testing happen under qualified supervision with the unit enclosed; the report includes the full safety rationale and the steps that must never be skipped.
Can the alarm thresholds be changed?
Yes — the under/over-frequency limits and the confirmation delay are firmware constants, and the calibration guide walks through setting them for your own build. The optional relay trip output can be wired to shed a demo load on confirmed deviation.
Is this project suitable for a final-year project?
Yes — for Electrical Engineering and power-systems programs. It demonstrates zero-crossing detection, interrupt-based frequency measurement, alarm logic with hysteresis, and the electrical-safety engineering (isolation, enclosure, qualified supervision) that a mains-connected build demands. The calibration procedure also gives the student measured numbers to defend in the viva.
Components & software requirements
- Arduino Uno (ATmega328P, C/C++ firmware in Arduino IDE)
- H11AA1 bidirectional optocoupler (zero-crossing sensing)
- HD44780-compatible 16x2 character LCD
- Step-down transformer + bridge/rectifier front end (isolated sensing supply)
- 5 V relay module (optional trip output)
- Piezo buzzer + indicator LEDs
- Pull-up and current-limiting resistor network (conditioning stage)
- Breadboard/PCB prototyping with hand-wired build
Delivery information
Built-to-order project. Delivery timeline is shared after order confirmation based on current queue.
Support terms
Complete documentation, setup guide, and viva preparation included. Support for setup and explanation provided.
Download free synopsis (PDF)
Enter your name and email — the synopsis PDF downloads immediately. We may send occasional project updates; no spam, unsubscribe anytime.