
More project photos (2)
The problem
Indoor air in classrooms, hostels and labs is often far worse than students assume — CO2 builds past 1000 ppm in a crowded room within an hour, and PM2.5 from cooking, traffic and construction dust settles into living spaces — yet nobody can see it. Commercial air monitors are expensive black boxes, and cheap gas-sensor toys give raw numbers with no context. The useful engineering gap is a monitor that combines real particulate sensing (not just a gas sensor), proper CO2 measurement, and a dashboard a non-engineer can read: an AQI gauge, live charts, and alerts when it is time to ventilate. This project builds exactly that on an ESP32: a PMS5003 laser PM2.5 sensor, an MH-Z19B NDIR CO2 sensor and a DHT22 temperature/humidity sensor feed firmware that publishes MQTT telemetry to a cloud dashboard with live charts, a US-EPA AQI gauge and configurable threshold alerts, plus an OLED for local readout. It is honest student hardware — the report states datasheet accuracies, not calibrated-instrument claims.
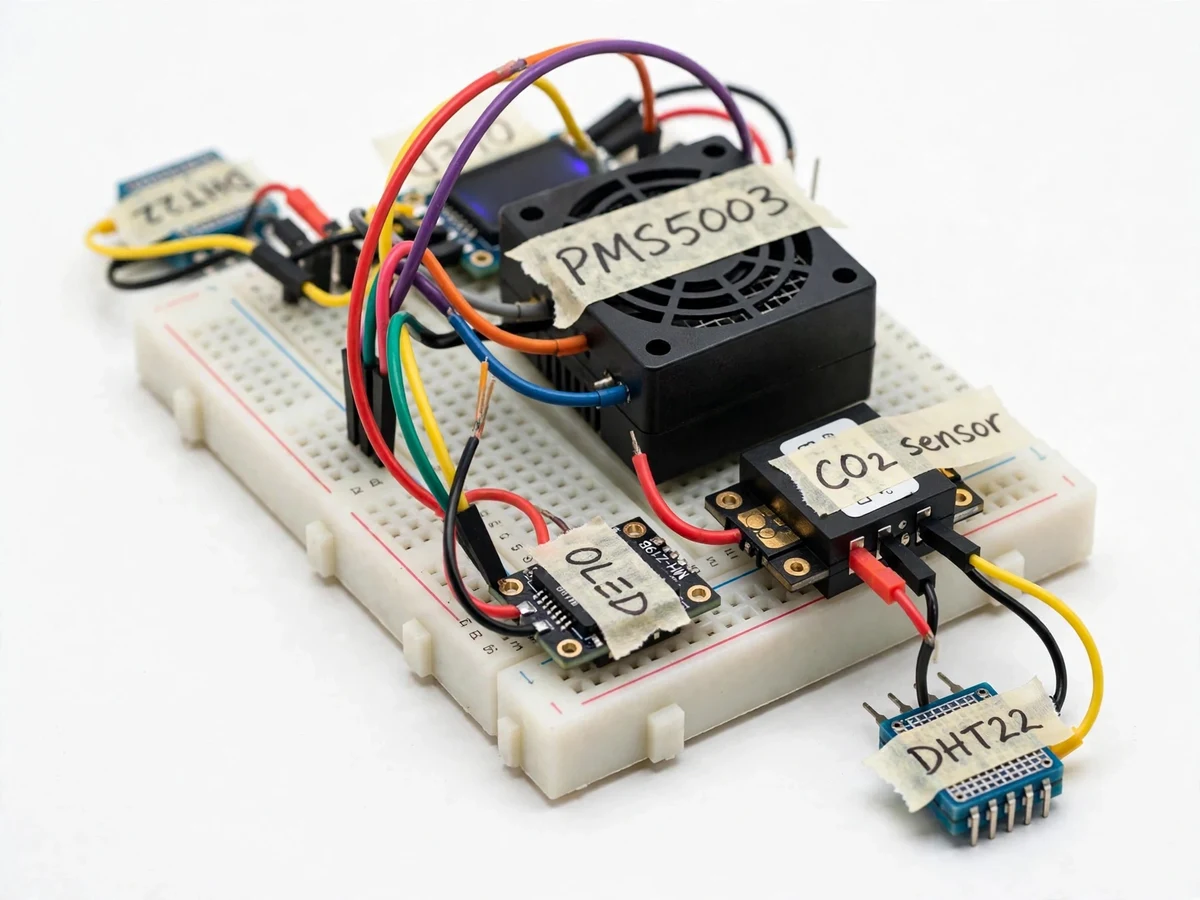
Laser-scattering sensor with internal fan; reports PM1.0/PM2.5/PM10 over UART about every second.
Follow the working sequence
How it works
- The PMS5003 actively draws room air through its internal fan and reports PM1.0/PM2.5/PM10 over UART at 9600 baud roughly every second; the MH-Z19B reads CO2 by NDIR absorption after a ~3-minute warm-up; the DHT22 is polled every 2 seconds over a single data line.
- The ESP32 parses each sensor frame, computes a US-EPA AQI value from the PM2.5 reading, and compares PM2.5 and CO2 against the configured thresholds (defaults: 100 µg/m³ and 1000 ppm).
- Every 10 seconds the ESP32 publishes one JSON telemetry frame over Wi-Fi to the MQTT broker (QoS 1) with automatic reconnect on drops.
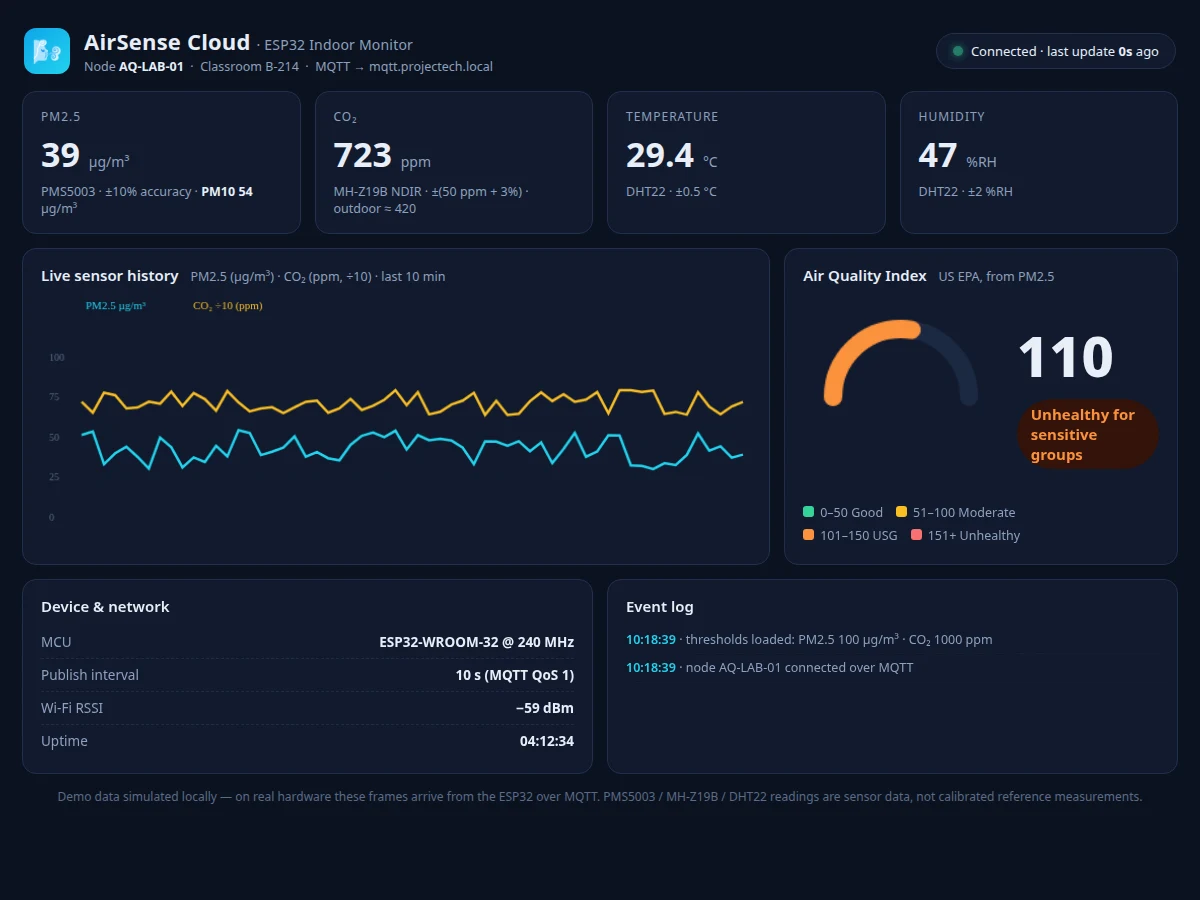
- The cloud dashboard subscribes to the topic and renders the live value cards, the 10-minute rolling history chart, the AQI gauge, the device-status panel and the event log; a crossed threshold raises the red alert banner.
- Locally, the OLED refreshes every 2 seconds with the latest four readings and a WARN flag, and the buzzer sounds on sustained exceedance — so the unit works even with no network.
- During setup the student runs the included calibration procedure: the MH-Z19B is exposed to fresh air (~400 ppm reference) for 20 minutes to set its zero baseline, and the PMS5003 is sanity-checked by placing two readings side by side — the resulting offsets go into the report.
Tech stack:
- ESP32-WROOM-32 · Arduino IDE (C/C++)
- PMS5003 PM2.5 sensor · MH-Z19B CO2 · DHT22
- MQTT telemetry (PubSubClient)
- 0.96-inch OLED (SSD1306) · buzzer
- HTML/CSS/JS cloud-dashboard demo
- Wi-Fi 802.11 b/g/n · JSON frames
- UART sensor interfacing
- Git
| Parameter | Value |
|---|---|
| PM2.5 range | 0–500 µg/m³ (PMS5003 datasheet) |
| PM accuracy | ±10% (datasheet; not a measured claim) |
| CO2 range | 400–5000 ppm (MH-Z19B datasheet) |
| CO2 accuracy | ±(50 ppm + 3% of reading) (datasheet) |
| Temperature / humidity accuracy | ±0.5 °C / ±2 %RH (DHT22 datasheet) |
| NDIR warm-up | ~3 minutes after power-on (datasheet) |
| Telemetry interval | 10 s default (configurable 2–300 s) |
| Alert thresholds | PM2.5 100 µg/m³ · CO2 1000 ppm (configurable) |
| Power | 5 V USB, design target ~300 mA average (module datasheet sums) |
| Dashboard | Single-file HTML demo; student hosts or runs locally |
Project features
- [PM2.5 sensing with PMS5003] Implemented — laser-scattering sensor with internal fan reports PM1.0/PM2.5/PM10 every ~1 s over UART; accuracy is the datasheet ±10%, stated honestly, not a measured claim.
- [CO2 sensing with MH-Z19B] Implemented — NDIR (non-dispersive infrared) module, 400–5000 ppm range, ±(50 ppm + 3% of reading) datasheet accuracy; needs ~3 minutes NDIR warm-up after power-on, handled in firmware.
- [Temperature and humidity with DHT22] Implemented — ±0.5 °C and ±2 %RH datasheet accuracy, polled every 2 s; readings are also used to sanity-check CO2 compensation conditions.
- [ESP32 firmware with MQTT telemetry] Implemented — publishes a compact JSON frame (pm25, co2, temp, rh, aqi, rssi) every 10 s over Wi-Fi with auto-reconnect; publish interval is configurable from 2 to 300 s.
- [Live cloud dashboard] Implemented — single-file HTML dashboard demo with PM2.5/CO2 history chart, US-EPA AQI gauge computed from PM2.5, device status panel and event log.
- [Threshold alerts] Implemented on the dashboard, configurable — defaults PM2.5 > 100 µg/m³ and CO2 > 1000 ppm raise a banner alert and local buzzer; thresholds and the optional Telegram alert hook are configurable.
- [Local OLED readout] Implemented — 0.96-inch SSD1306 OLED refreshes every 2 s with PM2.5, CO2, temperature, humidity and a WARN flag when thresholds are crossed.
- [Buyer-run calibration procedure] Implemented as documentation — a fresh-air baseline procedure for the MH-Z19B (~400 ppm reference) that the student performs on their own build and records in the report.
What is included
- Working ESP32 + PMS5003 + MH-Z19B + DHT22 + OLED prototype on breadboard
- Complete Arduino firmware (sensor drivers, AQI computation, MQTT publishing, OLED UI, alert logic)
- Cloud-dashboard demo (single-file HTML) wired to MQTT with charts, AQI gauge and alert banner
- Wiring diagram and sensor connection table
- MH-Z19B baseline calibration procedure for the student to run and report
- Project report PDF (background, sensor physics, methodology, limitations, results template)
- PPT presentation for final review
- Viva Q&A preparation document (laser scattering, NDIR, MQTT, AQI calculation, calibration)
Limitations & prerequisites
- These are low-cost sensors with datasheet — not calibrated — accuracies: PMS5003 ±10%, MH-Z19B ±(50 ppm + 3%), DHT22 ±0.5 °C / ±2 %RH. This is a teaching/IoT monitor, not a regulatory reference instrument.
- The MH-Z19B drifts without calibration; it needs the fresh-air baseline procedure repeated periodically (documented in the build kit).
- The PMS5003 is placement-sensitive — keep it away from cooking fumes and direct humidity condensation; it cannot distinguish particle types.
- The cloud dashboard needs Wi-Fi and an MQTT broker reachable from the ESP32; offline, only the OLED works (local-broker operation is a documented option, not the default).
- Nothing is measured or calibrated before order: the buyer runs the calibration procedure on their own build and the report records their values honestly — no accuracy certificate is claimed.
- Not suitable for medical or clinical air-quality decisions.
- The dashboard is a demo single file; production hosting (VPS/domain) is a configurable option, not included.
Frequently Asked Questions
How accurate are the sensors?
Only datasheet accuracy is claimed: PMS5003 ±10%, MH-Z19B ±(50 ppm + 3% of reading), DHT22 ±0.5 °C / ±2 %RH. This is an IoT learning monitor, not a calibrated reference instrument — the report states this explicitly, and the kit includes a buyer-run calibration procedure.
Does it work without internet?
The sensor prototype and OLED readout work fully offline. The cloud dashboard needs Wi-Fi and a reachable MQTT broker; a local-broker setup (e.g. a laptop running Mosquitto) is documented as an option.
Do I need to calibrate anything?
Yes, one step: the MH-Z19B CO2 sensor needs a fresh-air baseline (~400 ppm) exposure for 20 minutes on first setup, following the included procedure. The report template records the procedure and result.
Can I log data for my project report?
The dashboard demo shows live history and an event log. Logging to an SD card or a spreadsheet export is a configurable firmware option we can add to the build.
Why not just use a cheap MQ gas sensor?
MQ sensors give raw resistance values that drift and cross-react; the PMS5003 measures actual particulate mass and the MH-Z19B measures CO2 by infrared absorption — both give real physical units, which is what a viva expects.
Is this project suitable for a final-year project?
Yes — for IoT, Embedded Systems, Electronics and Instrumentation programs. It demonstrates multi-sensor interfacing, UART protocols, MQTT telemetry, dashboard design and honest sensor calibration. Suitable for B.E./B.Tech final-year projects in IoT, Embedded Systems, Electronics and Instrumentation.
Components & software requirements
- ESP32-WROOM-32 · Arduino IDE (C/C++)
- PMS5003 PM2.5 sensor · MH-Z19B CO2 · DHT22
- MQTT telemetry (PubSubClient)
- 0.96-inch OLED (SSD1306) · buzzer
- HTML/CSS/JS cloud-dashboard demo
- Wi-Fi 802.11 b/g/n · JSON frames
- UART sensor interfacing
- Git
Delivery information
Built-to-order project. Delivery timeline is shared after order confirmation based on current queue.
Support terms
Complete documentation, setup guide, and viva preparation included. Support for setup and explanation provided.
Download free synopsis (PDF)
Enter your name and email — the synopsis PDF downloads immediately. We may send occasional project updates; no spam, unsubscribe anytime.