
More project photos (3)
Watch it work
The problem
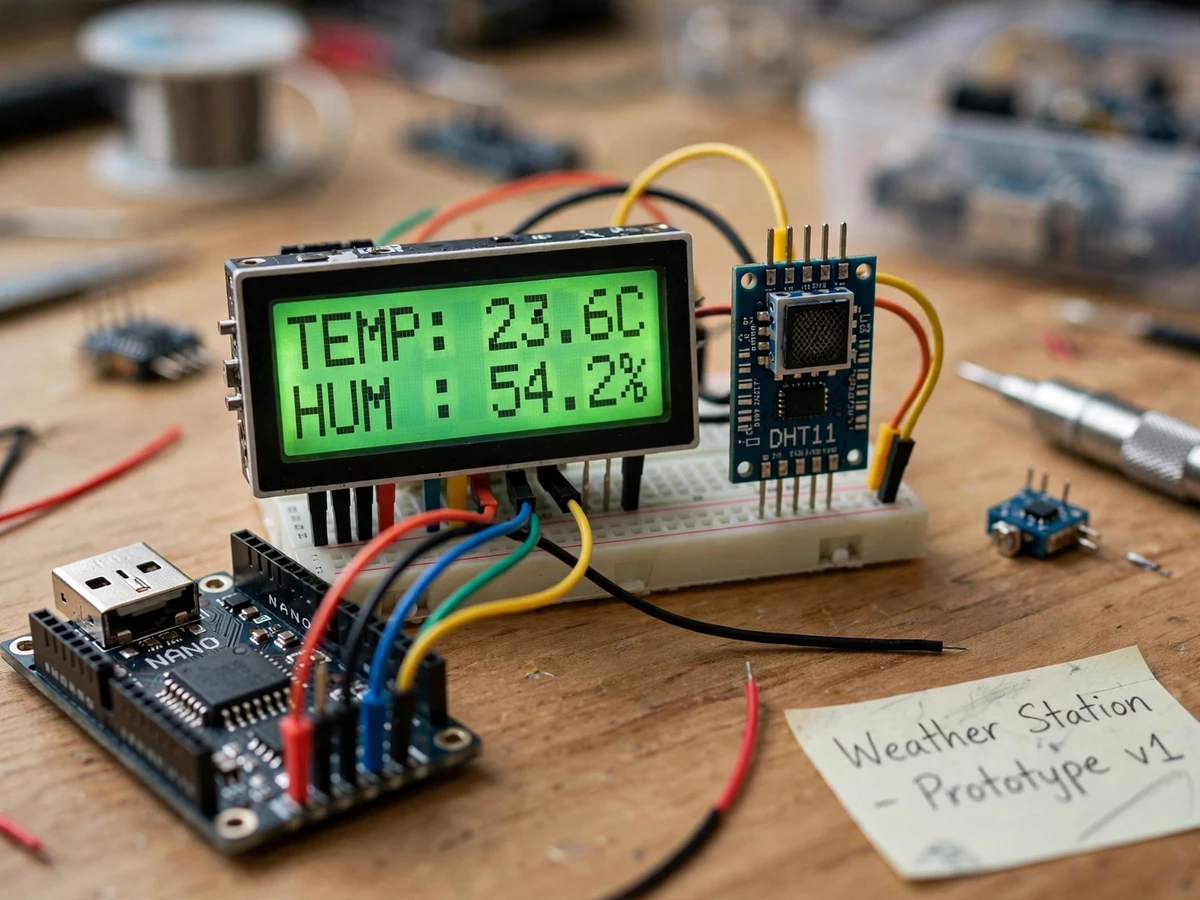
Temperature and humidity are the two quantities behind almost every local weather report, greenhouse controller and room-comfort system, yet students usually meet them only as numbers on a phone screen. This project makes both quantities visible on a bench: an Arduino Nano reads a DHT11 sensor and shows live temperature and humidity on a 16 by 2 character LCD, so the effect of a heat source or a spray of water can be watched as it happens. The build is deliberately small and local: no wireless link, no cloud account, no phone app, just a sensor, a controller and a display that update together.
How it works
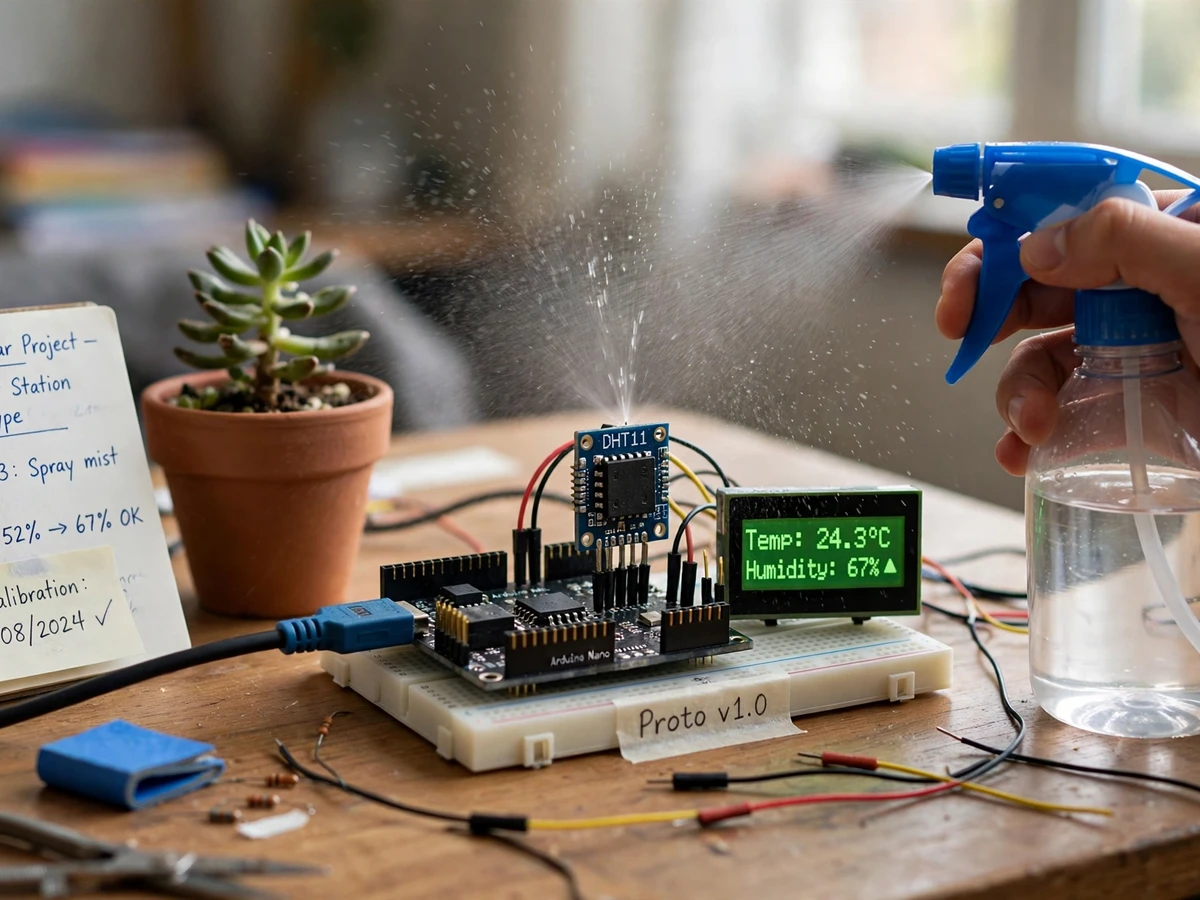
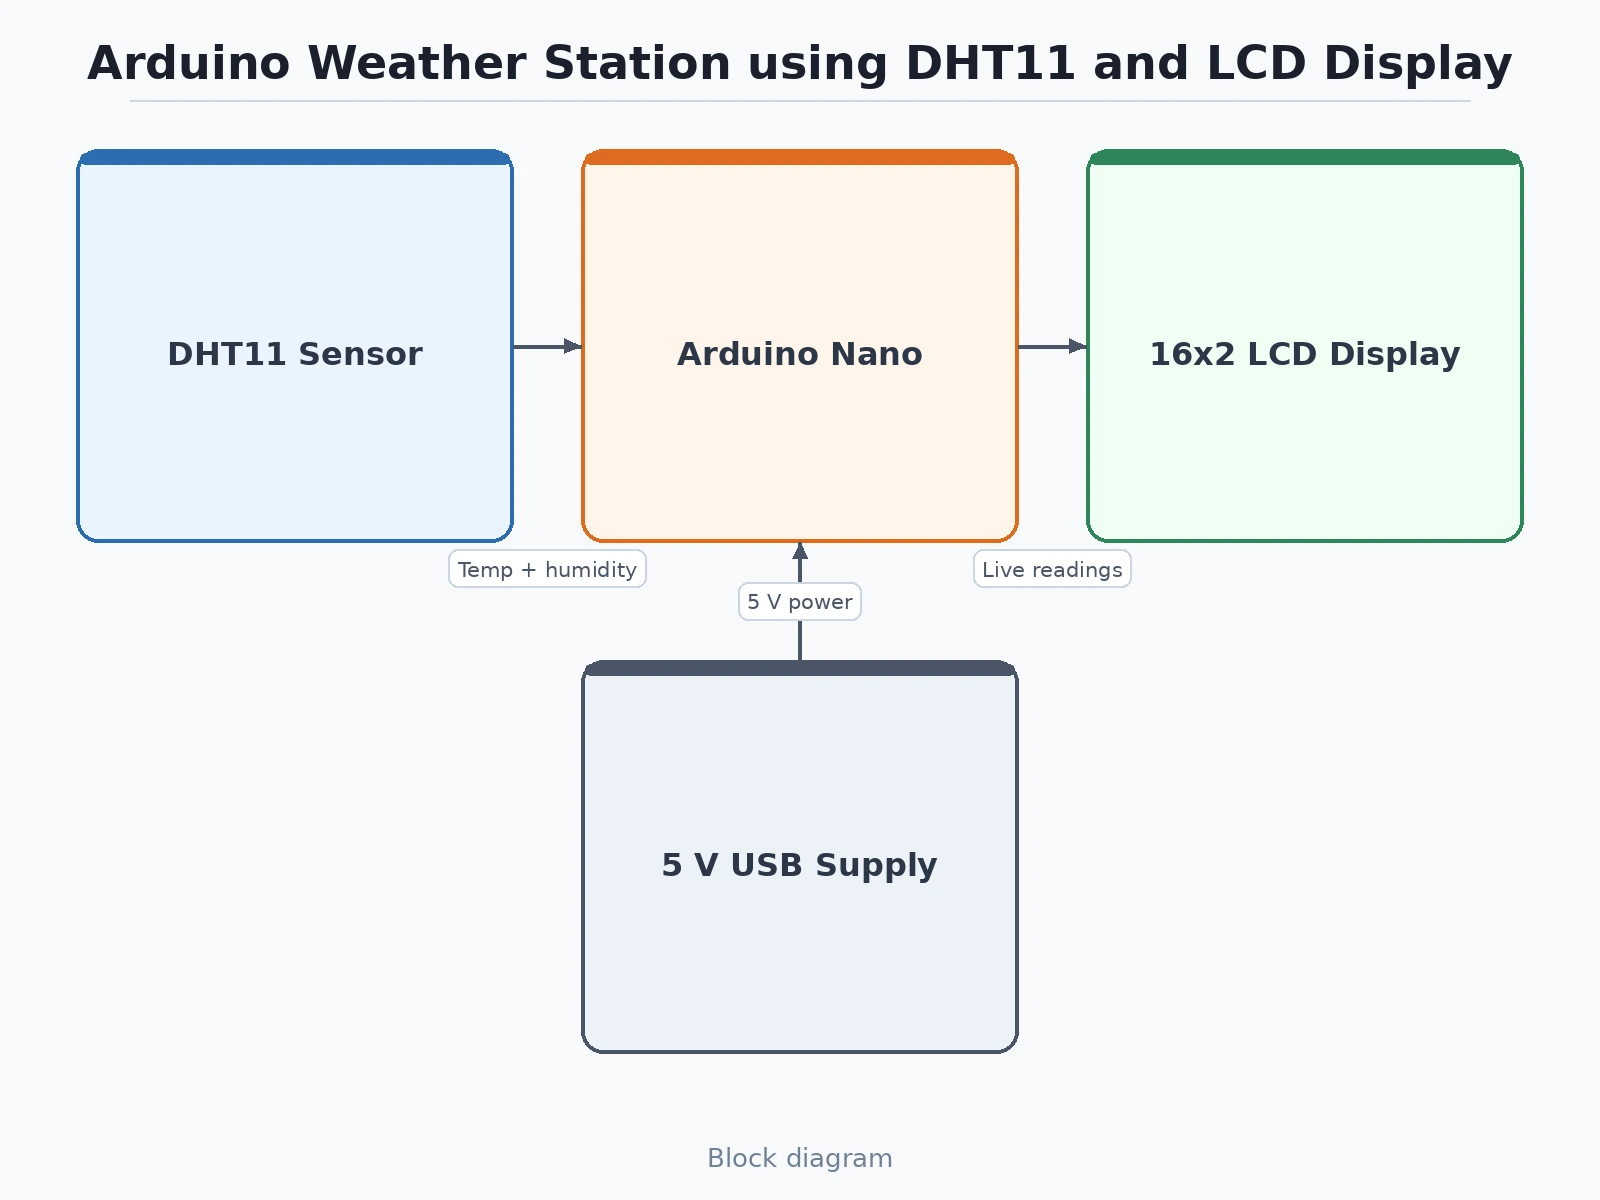
The end-to-end mechanism runs from the air in the room to two numbers on a screen. The DHT11 sensor measures the temperature and humidity of the air immediately around it and reports both as digital values. The Arduino Nano polls the sensor at regular intervals, formats the two readings, and writes temperature to the first LCD line and humidity to the second. Because the polling loop never stops, the display follows the room: when a heat source warms the air near the sensor the temperature line climbs, and when a water spray moistens the air near the sensor the humidity line climbs, with both changes visible within seconds and settling back as the air returns to normal.
- The builder assembles the station: the Arduino Nano, DHT11 sensor module and 16x2 LCD are mounted on a single prototyping board and wired with jumper wires, powered from a 5 V USB supply.
- The builder checks the sensor alone: the DHT11 readings are compared with a room thermometer and a general sense of the room's dampness, so a faulty sensor is caught before the display is trusted.
- The builder checks the display alone: the two-line layout is confirmed, so temperature and humidity are never confused on screen.
- For the room-reading demonstration, the builder powers the station and shows the display tracking ordinary room temperature and humidity over several minutes.
- For the heat response demonstration, the builder aims a heat source near the sensor and watches the temperature reading climb toward the high thirties on the display.
- For the water-spray response demonstration, the builder sprays water near the sensor and watches the humidity reading climb past eighty percent on the display, then settle back as the air dries.
- The builder writes up the results honestly, including the sensor's accuracy limits and every condition under which the readings should not be trusted.
Tech stack:
- Arduino Nano · ATmega328P controller board
- DHT11 sensor · temperature and humidity sensing
- 16x2 LCD display · live readings display
- Jumper wires and prototyping board · sensor and display wiring
- 5 V USB supply · bench power for the station
- Heat response test · temperature channel verification
- Water-spray response test · humidity channel verification
| Parameter | Value |
|---|---|
| Build type | Tabletop hardware build · sensor plus controller plus display on one prototyping board (design target) |
| Controller | Arduino Nano · ATmega328P · 5 V logic · USB powered (Datasheet value) |
| Sensor | DHT11 · digital temperature and humidity sensor · single data pin (Datasheet value) |
| Temperature range | 0 to 50 degrees Celsius · accuracy about plus or minus 2 degrees Celsius (Datasheet value) |
| Humidity range | 20 to 90 percent relative humidity · accuracy about plus or minus 5 percent relative humidity (Datasheet value) |
| Display | 16 by 2 character LCD · temperature on line one · humidity on line two (design target) |
| Power | 5 V USB supply · bench power · no battery pack in the base build (design target) |
| Heat response | Temperature reading rises toward the high thirties under a heat source · visible within seconds (demonstrated) |
| Humidity response | Humidity reading rises past eighty percent under a water spray · visible within seconds (demonstrated) |
| Logging | None in the base build · local display only · no wireless link and no cloud storage (design target) |
| Builder note | On the prototype, readings track one point in the room only, so a heat source or spray must be near the sensor to move the numbers, and the display settles back as the air returns to normal, so demonstrations run with the sensor exposed to room air and the report states the accuracy limits plainly · noted as a builder observation |
Project features
This station combines a small set of parts into a complete sensing demonstration rather than a display that shows fixed numbers. First, the sensor is read live and continuously, so the display tracks the room instead of showing a single measurement. Second, the two response tests turn the station into something an examiner can challenge: warm the sensor and the temperature must rise, spray water near it and the humidity must rise, with both changes visible within seconds. Third, the two-line display keeps the quantities separate and readable at a glance, so a visitor can read temperature and humidity without a manual. Fourth, the whole station runs from a single 5 V USB supply on one prototyping board, so it can sit on any table and run for a whole demonstration.
- [Live temperature and humidity readings] The DHT11 sensor is polled continuously by the Arduino Nano, and the 16x2 LCD updates both readings as the room changes, so the display tracks the air instead of showing a fixed value — implemented in the base build.
- [Heat response test] A heat source aimed near the sensor raises the temperature reading toward the high thirties, which the display shows within seconds, proving the temperature channel is genuinely sensing — implemented in the base build.
- [Water-spray response test] A spray of water near the sensor raises the humidity reading past eighty percent, which the display shows within seconds, proving the humidity channel is genuinely sensing — implemented in the base build.
- [Two-line LCD layout] Temperature on the first line and humidity on the second, so both quantities stay separate and readable at a glance without a manual — implemented in the base build.
- [Single-board tabletop station] Arduino Nano, DHT11 sensor and LCD on one prototyping board running from a 5 V USB supply, so the station sits on any table and runs continuously — implemented in the base build.
- [Wireless logging and forecasting] Future scope only, not implemented: adding a Wi-Fi module with cloud logging, graphs and forecasts, listed as an extension rather than a claimed feature, since the base build is a local display-only station.
What is included
- Complete fabricated tabletop weather station (Arduino Nano, DHT11 sensor module, 16x2 LCD, prototyping board, jumper wires, 5 V USB power lead)
- Sensor-reading firmware (DHT11 polling loop, two-line LCD formatting, continuous display update)
- Setup and testing guide (sensor check procedure, display check procedure, heat response test, water-spray response test, accuracy-limits worksheet)
- Project report PDF (sensor interfacing background, polling-loop design, response-test demonstration results, honest accuracy observations)
- PPT presentation for final review
- Viva Q&A preparation document (DHT11 working principle, polling versus interrupts, LCD interfacing, accuracy limits, local versus wireless stations)
Limitations & prerequisites
- Accuracy limits are real: the DHT11 reads temperature to about plus or minus 2 degrees Celsius and humidity to about plus or minus 5 percent relative humidity, so it suits room monitoring and teaching, not weather forecasting, climate control, or any measurement that needs laboratory precision.
- One point in the room only: the sensor measures the air immediately around it, so it reports room conditions, not outdoor weather, and a heat source or spray must be near the sensor to move the numbers.
- No logging and no wireless link: the base build shows live readings only, with no stored history, no graphs, no phone app and no cloud dashboard, so trends over days cannot be shown without the wireless-logging extension.
- No forecasting: the station reports what the air is now and cannot predict rain, heat or any future condition, so it must not be presented as a meteorological forecasting instrument.
- Indoor tabletop use only: the open prototyping board and USB power suit a bench demonstration, and the build is not weatherproofed, battery powered or designed for outdoor mounting.
- This is an academic prototype, not a certified product: bench electronics need supervision, and the heat-source test needs care so the sensor and board are warmed, never scorched.
Frequently Asked Questions
Is this a good choice for a college project?
Yes, for Electronics and IoT programs, because it combines sensor interfacing, embedded firmware, LCD display driving, and a demonstration an examiner can challenge on the spot. It gives a clear review thread: how the DHT11 reports two quantities over one data pin, how a polling loop keeps a display live, why the heat and water-spray tests prove the sensor is genuinely sensing, and where an inexpensive sensor's accuracy limits begin.
How do the heat and water-spray tests prove the station works?
Because both tests move only the quantity they should move. A heat source near the sensor raises the temperature reading while the humidity reading stays plausible, and a water spray near the sensor raises the humidity reading while the temperature reading stays plausible. If the display showed fixed numbers, neither test would change anything, so a visible change within seconds is the proof the sensor loop is live.
How accurate are the readings?
The DHT11 datasheet states about plus or minus 2 degrees Celsius for temperature and about plus or minus 5 percent relative humidity, over 0 to 50 degrees Celsius and 20 to 90 percent relative humidity. That is plenty for room monitoring and teaching, and the report states these limits plainly rather than presenting the readings as precision measurements.
Can this station show outdoor weather or forecasts?
No. The sensor measures the air immediately around it, so it reports room conditions, and it has no wireless link, no stored history and no forecasting model. Outdoor mounting would also need weatherproofing and a power solution the base build does not include, so the honest claim is a room weather station, not a meteorological station.
What happens if the sensor is covered or the room is very dry?
A covered sensor reads the trapped air around itself rather than the room, and readings outside the DHT11 range (below 20 percent humidity or outside 0 to 50 degrees Celsius) should not be trusted. Demonstrations therefore run with the sensor exposed to room air, and the report notes these conditions as limits.
Can logging or a phone app be added later?
Yes, as an extension: a Wi-Fi module can send readings to a cloud dashboard for graphs and history. That is listed as future scope because the base build is deliberately local and display-only, so the extension is a separate piece of work with its own testing, not a feature the base build already claims.
Components & software requirements
- Arduino Nano · ATmega328P controller board
- DHT11 sensor · temperature and humidity sensing
- 16x2 LCD display · live readings display
- Jumper wires and prototyping board · sensor and display wiring
- 5 V USB supply · bench power for the station
- Heat response test · temperature channel verification
- Water-spray response test · humidity channel verification
Delivery information
Built-to-order project. Delivery timeline is shared after order confirmation based on current queue.
Support terms
Complete documentation, setup guide, and viva preparation included. Support for setup and explanation provided.
Download free synopsis (PDF)
Enter your name and WhatsApp number — the synopsis PDF downloads immediately. We may send occasional project updates on WhatsApp; no spam.