
More project photos (2)
The problem
Everyone has a dead zone at home — the corner where video calls freeze — but nobody measures it; they just move the router by guesswork. Phone WiFi APIs expose exactly the data needed to do better: scan results with SSID, band, channel and RSSI, plus the ability to run throughput tests. Yet free speed-test apps give a single number with no spatial context, and scanner apps give numbers with no map. WiFiMapper combines all three: the scanner ranks every nearby access point and flags congested channels, coverage mode turns a walk through the house into a painted heatmap, and the speed test records the four standard metrics per room. The output is actionable — where signal is weak, which channel to switch to, whether the extender actually helped — instead of a vague "internet is slow here".
How it works
- The scanner screen lists access points sorted by RSSI, each with band, channel, security and a live dBm reading; overlapping channels are counted to flag congestion.
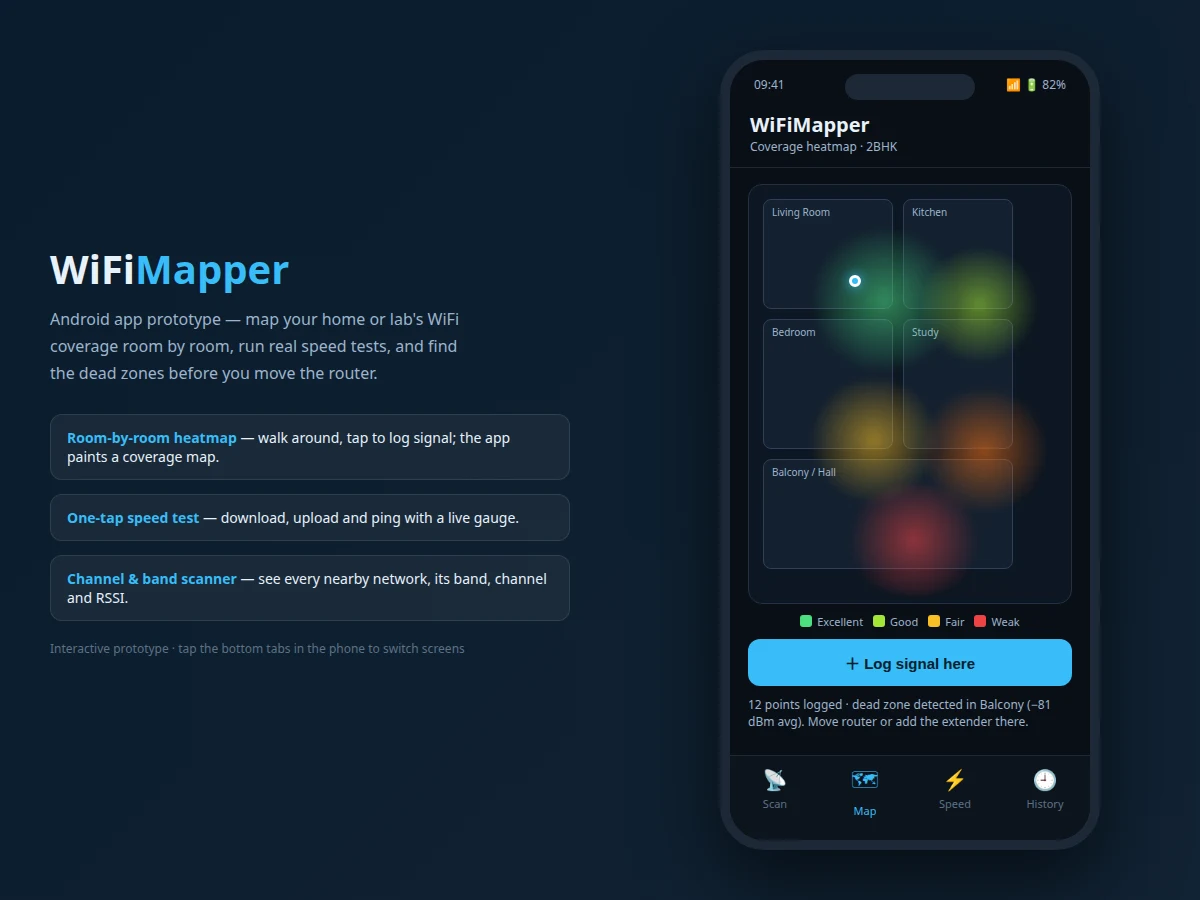
- In coverage mode the user taps "log signal" at each spot; the (position, RSSI, room) sample is stored and the heatmap gradient re-renders.
- Room averages are computed from the samples; rooms below −70 dBm average are labeled dead zones with a placement suggestion.
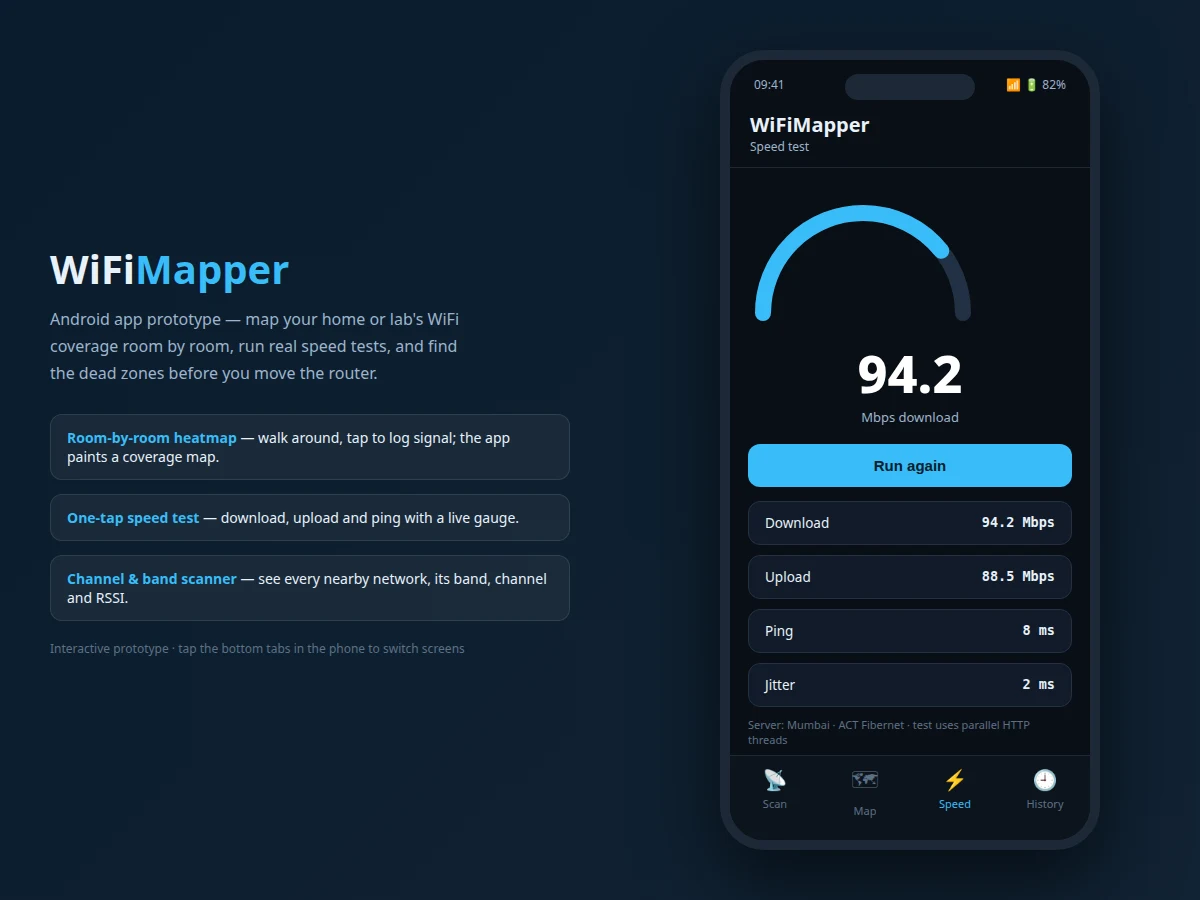
- The speed test animates the gauge along a simulated multi-thread download curve, then reports download, upload, ping and jitter with the test server named.
- Each test is appended to history as a timestamped card (metrics, room, ping); CSV export formats the same records.
- Bottom-tab navigation switches the four screens; the prototype mirrors the native app's information architecture one to one.
Tech stack:
- Interactive web prototype: HTML5, CSS3, vanilla JavaScript (phone-frame UI)
- Inline SVG/CSS heatmap rendering, animated SVG gauge
- Native build path: Kotlin, WifiManager / ConnectivityManager APIs
- Local persistence path: Room database; export: CSV
- No backend — on-device measurement and storage
| Parameter | Value |
|---|---|
| Prototype screens | 4 (Scan, Map, Speed, History) (as shipped) |
| Networks in demo scan | 5 with band/channel/RSSI detail (as shipped) |
| Heatmap zones | 4 signal bands (excellent/good/fair/weak) (as shipped) |
| Dead-zone threshold | Rooms averaging below −70 dBm (design target) |
| Speed metrics | Download, upload, ping, jitter (4 metrics) (as shipped) |
| History entries in demo | 5 timestamped with room tags (as shipped) |
| Prototype size | Single HTML file, approximately 16 KB (expected) |
| Native target | Android 10+ (design target for the native build) |
Project features
- [Network scanner] Every nearby AP with SSID, band (2.4/5 GHz), channel, security type and live RSSI, ranked by signal strength with signal bars.
- [Congestion detection] Channels shared by multiple networks are flagged, with a note on which channel is clearest.
- [Coverage heatmap] Log RSSI room-by-room on a floor plan; the map paints excellent/good/fair/weak zones and calls out dead zones (rooms averaging below −70 dBm).
- [Guided speed test] One-tap test with an animated gauge reporting download, upload, ping and jitter, tagged with server and location.
- [Test history] Timestamped result cards per room with a CSV export option for the report.
- [Phone-frame prototype] All four screens (Scan, Map, Speed, History) demonstrated interactively in a mobile UI, bottom-tab navigation.
- [Native build path documented] The report maps each prototype screen to Android APIs (WifiManager, throughput measurement, Room database).
What is included
- Fully interactive web prototype of all four app screens
- Screen-by-screen native API mapping document (which Android API powers each feature)
- Project report PDF (background, WiFi measurement theory, methodology, screenshots)
- PPT presentation for final review
- Viva Q&A preparation document (RSSI interpretation, bands/channels, throughput testing)
- User guide for demonstrating the prototype
Limitations & prerequisites
- The deliverable is an interactive prototype demonstrating all screens and logic; the native Kotlin build is documented as the build path, not shipped as an APK.
- Speed-test figures in the prototype are simulated curves for UI demonstration, not measured throughput — the report states this explicitly.
- Real RSSI scanning needs Android location permission and a physical device; the prototype uses curated realistic data.
- Heatmap interpolation in the prototype is illustrative; the native design specifies the sampling approach.
Frequently Asked Questions
Is this a real installable app?
The deliverable is a fully interactive prototype demonstrating every screen, flow and logic with realistic data, plus a documented native build path mapping each screen to Android APIs. It is presented honestly as a prototype.
How does the heatmap work?
You log the signal at spots around the home; each (position, RSSI, room) sample re-renders the gradient, room averages are computed, and weak rooms are flagged as dead zones with a suggestion.
What do the speed numbers mean in the prototype?
They demonstrate the UI flow (gauge animation, four metrics, history cards). The report clearly marks them as simulated and explains how the native build measures real throughput.
Why not just use an existing speed-test app?
Those give one number with no location context. WiFiMapper ties every measurement to a room and a map, which is what turns "slow internet" into "the bedroom is a dead zone — move the extender there".
What should I be able to explain in the viva?
What RSSI/dBm mean, why 5 GHz is faster but shorter-range than 2.4 GHz, how channel congestion happens, and which Android APIs the native build uses — all in the Q&A document.
Is this project suitable for a final-year project?
Yes — for Computer Science, IT and Electronics & Telecommunication programs. It applies wireless concepts to a real problem with a polished mobile UI. Suitable for B.E./B.Tech final-year projects in Computer Science, IT and Electronics & Telecommunication.
Components & software requirements
- Interactive web prototype: HTML5, CSS3, vanilla JavaScript (phone-frame UI)
- Inline SVG/CSS heatmap rendering, animated SVG gauge
- Native build path: Kotlin, WifiManager / ConnectivityManager APIs
- Local persistence path: Room database; export: CSV
- No backend — on-device measurement and storage
Delivery information
Built-to-order project. Delivery timeline is shared after order confirmation based on current queue.
Support terms
Complete documentation, setup guide, and viva preparation included. Support for setup and explanation provided.