
More project photos (2)
The problem
Downtime is revenue and reputation loss, yet many small businesses learn about outages from angry customers instead of monitoring. Single-location pings cry wolf on every network blip, so teams ignore them. This project builds monitoring done right: scheduled checks from multiple regions, quorum logic that declares downtime only when regions agree across consecutive checks, flapping suppression, and alerts that reach Slack, SMS and email within a minute of confirmation. Response-time history with visible outage gaps, incident timelines with root-cause notes, and public status pages complete the service — everything a small team needs to stop finding out about downtime from Twitter.
How it works
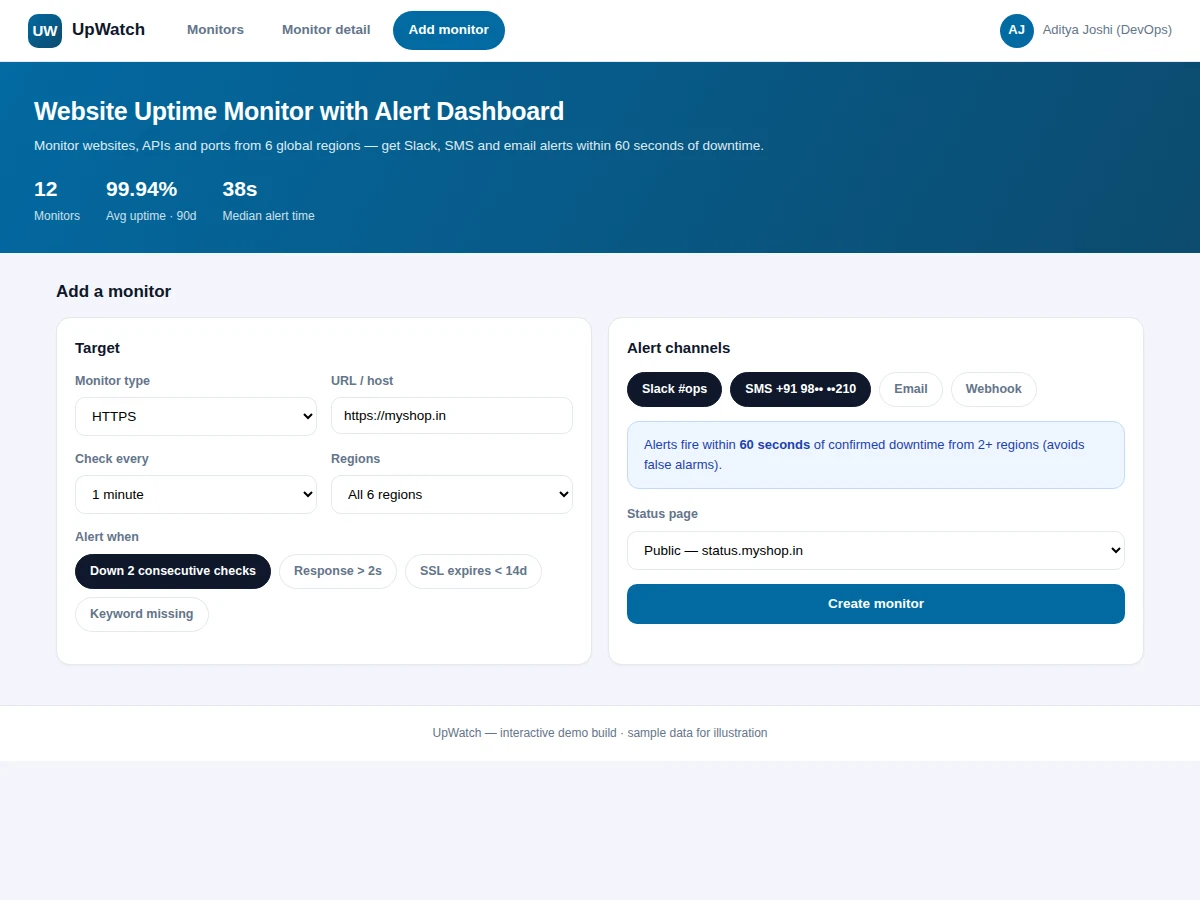
- The user creates a monitor: target, type, check interval, regions and alert channels.
- The scheduler dispatches check jobs; regional workers probe and report status plus timing.
- The evaluator applies quorum rules — for example, 2 of 3 regions failing twice in a row — before declaring downtime.
- On confirmation, an incident opens and alerts fan out to Slack, SMS and email within 60 seconds.
- Recovery needs consecutive successes before the incident auto-closes; every transition is logged.
- Dashboards show live status, response-time charts and the incident log; status pages keep customers informed.
Tech stack:
- Python (FastAPI/Django) or Node.js; task queue (Celery/RQ) for scheduling
- PostgreSQL/MySQL or time-series store for check results
- Lightweight regional prober workers
- HTML5, CSS3, JavaScript dashboards with charts
- Slack webhook, SMS gateway, SMTP alert integrations
| Parameter | Value |
|---|---|
| Monitor types | HTTPS, keyword, TCP port, ping, SSL expiry |
| Alert SLA | Within 60 seconds of confirmed downtime |
| Quorum | Configurable regions + consecutive failures |
| Check interval | 1 min, 5 min, 15 min options |
| Recovery | Consecutive successes before auto-close |
| Status pages | Public or team-private |
| Demo data | 6 monitors incl. live down incident (simulated) |
Project features
- [Multi-type monitors] HTTPS, API keyword, TCP port, ping and SSL-expiry checks with per-monitor intervals.
- [Quorum-based alerting] Downtime declared only on multi-region agreement across consecutive checks — no false alarms.
- [Sub-60-second alerts] Slack, SMS, email and webhook fan-out with escalation on continued outage.
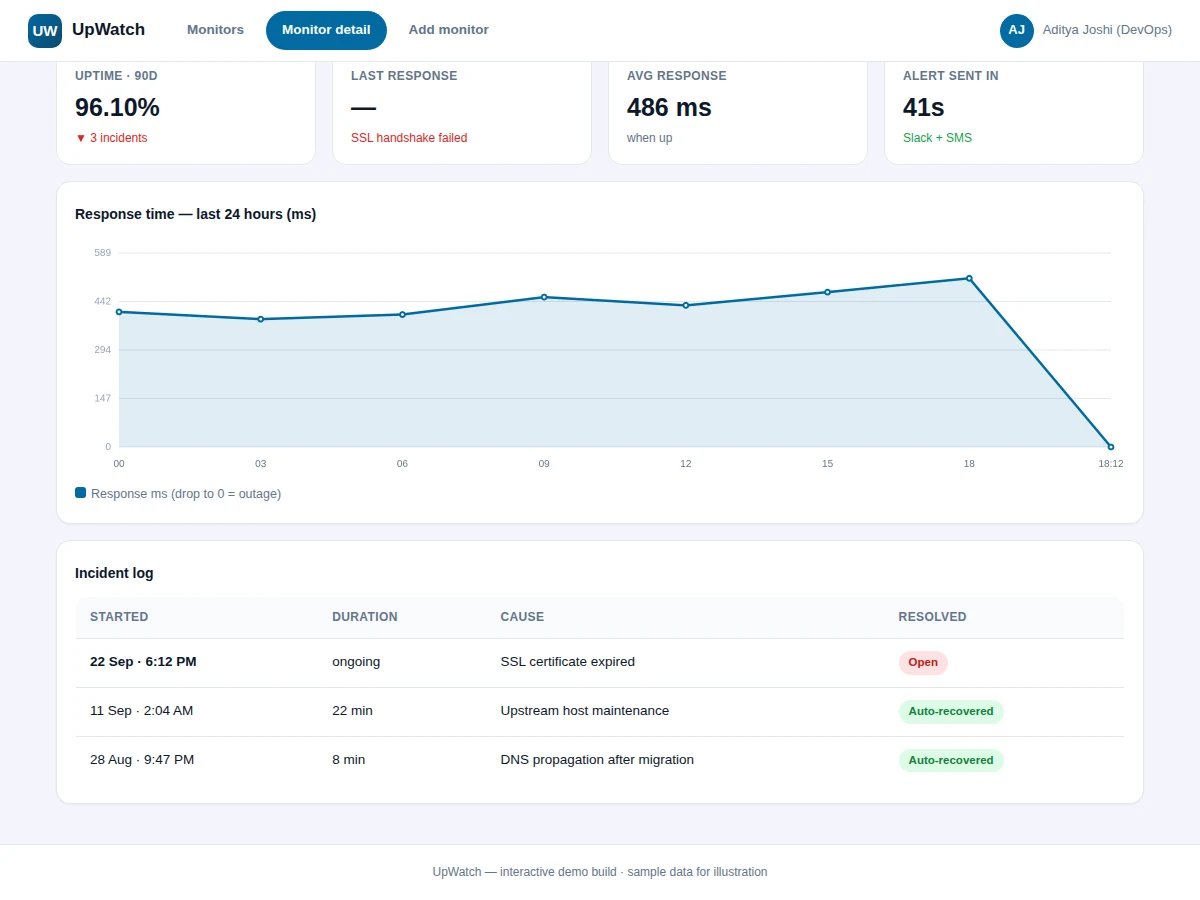
- [Response-time charts] 24-hour latency series with outage gaps visibly marked.
- [Incident logs] Every incident with start, duration, cause notes and resolution state for postmortems.
- [Status pages] Public or team-private pages aggregating monitor states during incidents.
- [SSL monitoring] Certificate-expiry warnings before the outage happens.
What is included
- Complete monitoring application (monitors, dashboards, status pages)
- Check scheduler with quorum-based decision engine
- Multi-channel alert dispatcher
- Incident-log and postmortem views
- Project report PDF (monitoring architecture, quorum design)
- PPT presentation for final review
- Viva Q&A preparation document (distributed checks, false positives, SLAs)
Limitations & prerequisites
- The academic build simulates multiple regions locally; real multi-region deployment needs cloud VMs.
- Alert delivery needs Slack/SMS/email accounts configured at deployment.
- Synthetic transaction checks (login flows) are future scope; probes are protocol-level.
- Historical retention in the demo is 90 days of aggregates; longer retention needs storage planning.
- On-call rotation and escalation policies are future scope.
Frequently Asked Questions
How does it avoid false alarms?
A single failed check from one region never alerts. Downtime is declared only when a quorum of regions agrees across consecutive checks, which filters out transient network blips while still alerting within a minute of real outages.
What can it monitor?
HTTPS/HTTP endpoints, API responses containing an expected keyword, TCP ports, ping, and SSL certificate expiry — covering websites, APIs and services.
How fast are alerts?
Within 60 seconds of confirmed downtime, fanning out to Slack, SMS, email and webhooks simultaneously.
What is a status page for?
During an incident, customers check the status page instead of flooding support. It aggregates all monitor states publicly or for the team only.
Is this project suitable for a final-year project?
Yes — for Computer Science and IT programs. It demonstrates scheduling, distributed agreement (quorum), alerting pipelines and SLA thinking. Suitable for B.E./B.Tech final-year projects in Computer Science and IT.
Components & software requirements
- Python (FastAPI/Django) or Node.js; task queue (Celery/RQ) for scheduling
- PostgreSQL/MySQL or time-series store for check results
- Lightweight regional prober workers
- HTML5, CSS3, JavaScript dashboards with charts
- Slack webhook, SMS gateway, SMTP alert integrations
Delivery information
Built-to-order project. Delivery timeline is shared after order confirmation based on current queue.
Support terms
Complete documentation, setup guide, and viva preparation included. Support for setup and explanation provided.