
More project photos (2)
The problem
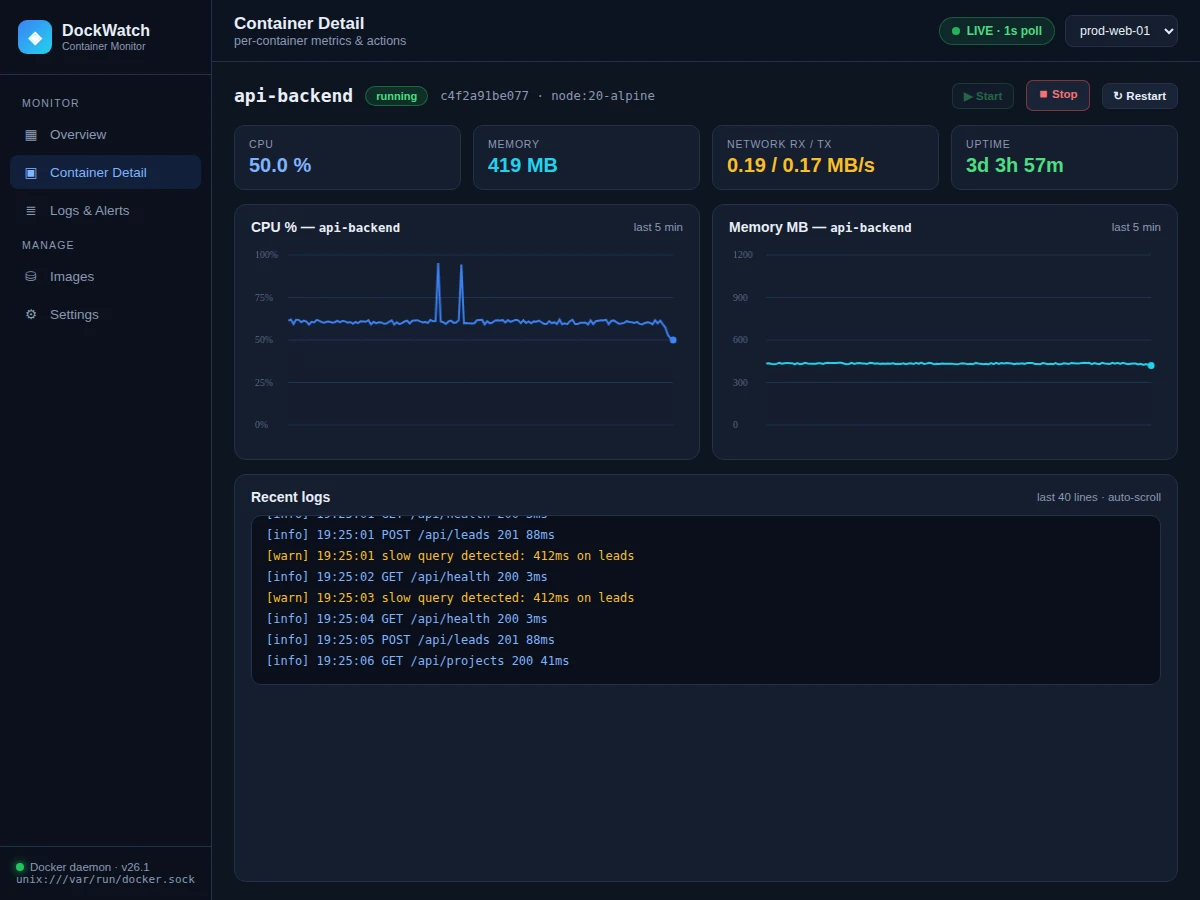
Anyone who has run more than a handful of Docker containers knows the pain: docker stats gives you a flickering terminal table, docker logs means a separate command per container, and noticing that one container is eating all the CPU requires you to be watching at exactly the right moment. Teams work around this with heavyweight platforms, but students learning DevOps rarely get to see — let alone build — the layer in between: a lightweight, glanceable dashboard that turns the Docker Engine API into live graphs and actionable controls. That gap is what this project fills. DockWatch connects to the Docker daemon on a host, polls container statistics every second, and presents them as a modern operations dashboard: cluster-wide CPU and memory charts, a per-container table with live sparklines, a detail view with resource graphs, aggregated log streaming, and alerts that fire when a container crosses a CPU threshold. Every control is real — start, stop and restart issue actual Docker API calls — so the viva demo runs against a genuine container workload, not canned data.
Watches live graphs, drills into containers and issues start, stop and restart.
Follow the working sequence
How it works
- The Python backend connects to the Docker daemon (unix socket or TCP) and lists containers via the
/containers/jsonEngine API endpoint. - Every second it opens a one-shot stats stream (
/containers/<id>/stats?stream=false) per running container and extracts CPU, memory, network and block I/O counters. - Samples are written to a local time-series store (SQLite), keeping a rolling window of recent history for graphs and sparklines.
- The backend computes deltas between samples to derive CPU percentage and per-second network rates, then pushes the fresh state to browsers over WebSockets.
- The frontend renders KPI cards, cluster charts and per-container graphs from the pushed data, refreshing in place with no page reloads.
- Operator actions (start/stop/restart) are sent as POST calls to the matching Docker Engine endpoints; the next poll cycle reflects the new container state automatically.
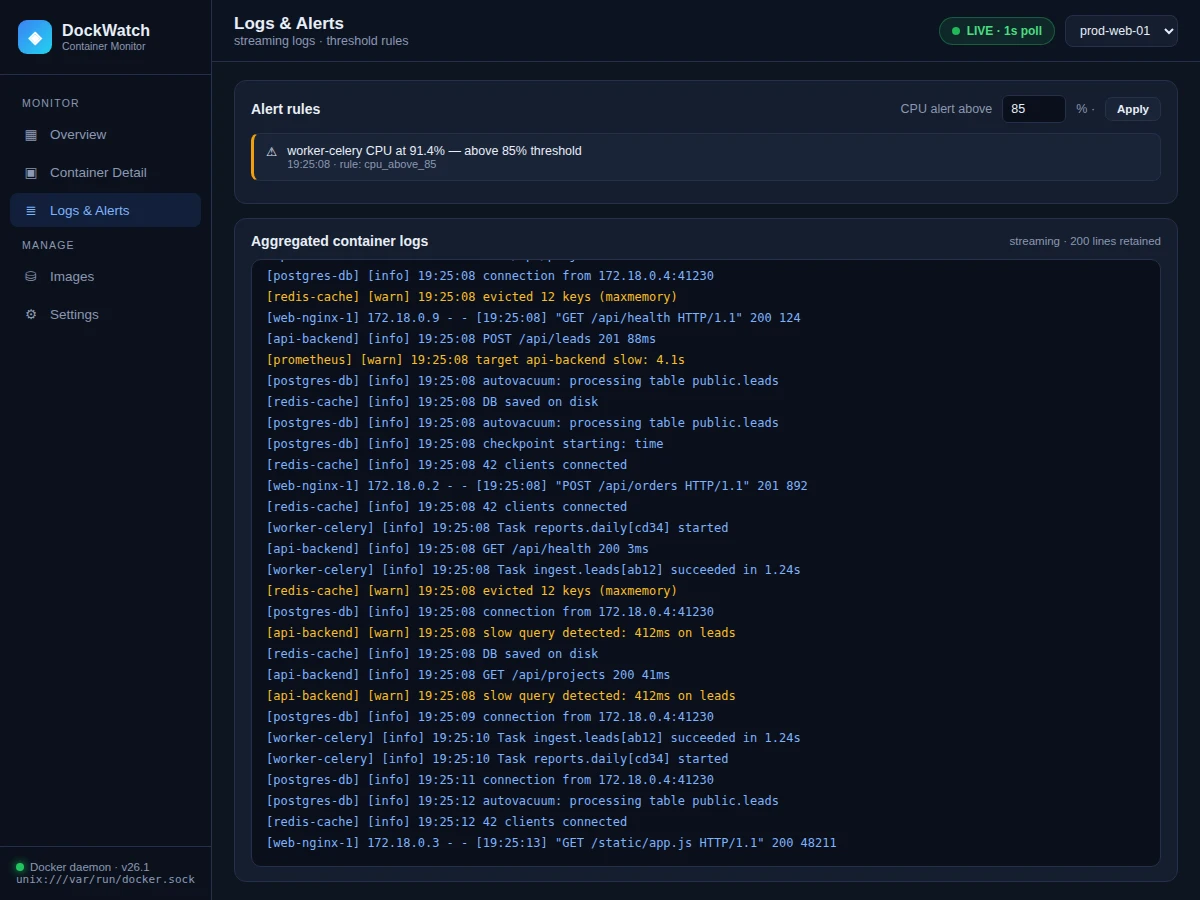
- The alerting engine compares each container's CPU against the configured threshold after every poll and records an alert entry with timestamp and rule name when it is crossed.
- Log streaming tails each container's stdout/stderr via the
/containers/<id>/logs?follow=trueendpoint and multiplexes the lines into the aggregated, color-coded log view.
Tech stack:
- Python 3 · Flask (backend API)
- Docker Engine API (stats, logs, lifecycle control)
- SQLite (rolling time-series metric store)
- WebSockets (live browser push)
- JavaScript · Canvas charts (frontend rendering)
- HTML5 · CSS3 (dashboard UI)
- Gunicorn (production serving)
- Git
| Parameter | Value |
|---|---|
| Metric poll interval | 1 second (configurable, design target) |
| Metric history window | Approximately 150 samples per container (configurable) |
| Containers monitored | Single Docker host; multi-host is optional customization |
| Graphs rendered | Cluster CPU/memory, per-container CPU/memory, table sparklines |
| Alerting | CPU threshold rule, configurable 1–100% (default 85%) |
| Log retention (dashboard) | Approximately last 200 aggregated lines in view |
| Backend runtime | Python 3.10+; Docker daemon access required (socket or TCP) |
| Browser support | Any modern Chromium/Firefox (expected) |
| Demo workload | 6–8 sample containers (nginx, Node API, Postgres, Redis, worker) included for the demo |
Project features
- [Live cluster overview] One screen shows running-container count, host CPU, host memory and network I/O as KPI cards, plus rolling cluster CPU and memory line charts updated every second.
- [Per-container resource graphs] Each container gets its own detail view with live CPU-percentage and memory-usage graphs, current RX/TX network rates and uptime — click any row in the container table to drill in.
- [Real start / stop / restart] Dashboard buttons issue genuine Docker Engine API calls, and the container's status badge, graphs and table row update immediately to reflect the change.
- [Aggregated log streaming] Logs from all running containers stream into one color-coded view (info, warning, error highlighting), with a per-container log tail on the detail screen — no more juggling
docker logsper container. - [CPU threshold alerts] A configurable rule (default 85%) raises an alert card with timestamp whenever a container crosses the limit; the threshold is adjustable from the dashboard without a restart.
- [Container table with sparklines] Every container row shows its image, live status badge, current CPU and memory, and a 5-minute trend sparkline so anomalies are visible before opening the detail view.
- [Multi-view navigation] Overview, container detail and logs/alerts views with a persistent sidebar, host selector and a live-connection indicator showing the 1-second poll heartbeat.
What is included
- Complete monitoring backend source code (Docker API polling, time-series store, WebSocket push, alerting engine)
- Live dashboard frontend (overview, container detail, logs & alerts views)
- Demo workload setup: docker-compose file spinning up the sample containers used in the demo
- Setup guide: connecting to a local or remote Docker daemon, socket vs TCP configuration
- Project report PDF (background, Docker Engine API study, architecture, polling design, alerting logic)
- PPT presentation for final review
- Viva Q&A preparation document (Docker Engine API, stats calculation, WebSockets, time-series storage)
Limitations & prerequisites
- Monitors a single Docker host as shipped — multi-host aggregation across a Swarm or fleet is an optional customization, not included.
- Requires read/write access to the Docker daemon (socket mount or TCP); the dashboard cannot monitor a host it cannot reach, and daemon credentials must be managed by the operator.
- CPU percentage is derived from Engine API counter deltas, so the first sample after container start is approximate until two samples exist.
- 1-second polling adds a small, expected load on the daemon; on hosts with hundreds of containers the interval should be relaxed (documented in the setup guide).
- The alerting engine covers CPU thresholds only in the base build — memory or disk rules are optional additions.
- Log streaming follows container stdout/stderr; applications that log only to files inside the container are not captured unless they also log to stdout.
- This is an academic monitoring build, not a hardened production observability platform — no authentication hardening, audit logging or long-term retention beyond the rolling window.
Frequently Asked Questions
Does this connect to real Docker or is it simulated?
Real Docker. The backend talks to the Docker Engine API over the daemon socket (or TCP): container listing, one-shot stats, log tails and start/stop/restart all hit the actual daemon. The demo ships with a docker-compose workload so the dashboard has genuine containers to show from the first run.
How is CPU percentage calculated?
The Engine API exposes cumulative CPU counters, not percentages. The backend takes two consecutive samples one second apart and computes the delta relative to system CPU delta — the same method the docker stats CLI uses — then stores and graphs the result.
Can it monitor containers on another machine?
As shipped it monitors one host. Pointing it at a remote daemon over TCP is a configuration change (documented), and true multi-host aggregation is available as an optional customization.
Does it need the internet to run?
No. Everything runs locally: the backend, the SQLite store and the dashboard work fully offline as long as the browser can reach the backend and the backend can reach the Docker daemon.
How is this different from just using Portainer?
Portainer is a full management platform; this project is a focused, student-built monitoring stack whose entire pipeline — API polling, delta math, time-series storage, WebSocket push, alerting — is implemented from scratch and documented for the viva, which is exactly what examiners ask about.
Is this project suitable for a final-year project?
Yes — for Computer Science and IT programs. It demonstrates REST API integration, time-series data handling, real-time web push, systems-level Docker knowledge and a genuinely usable DevOps tool. Suitable for B.E./B.Tech final-year projects in Computer Science and IT.
Components & software requirements
- Python 3 · Flask (backend API)
- Docker Engine API (stats, logs, lifecycle control)
- SQLite (rolling time-series metric store)
- WebSockets (live browser push)
- JavaScript · Canvas charts (frontend rendering)
- HTML5 · CSS3 (dashboard UI)
- Gunicorn (production serving)
- Git
Delivery information
Built-to-order project. Delivery timeline is shared after order confirmation based on current queue.
Support terms
Complete documentation, setup guide, and viva preparation included. Support for setup and explanation provided.
Download free synopsis (PDF)
Enter your name and email — the synopsis PDF downloads immediately. We may send occasional project updates; no spam, unsubscribe anytime.