
More project photos (2)
The problem
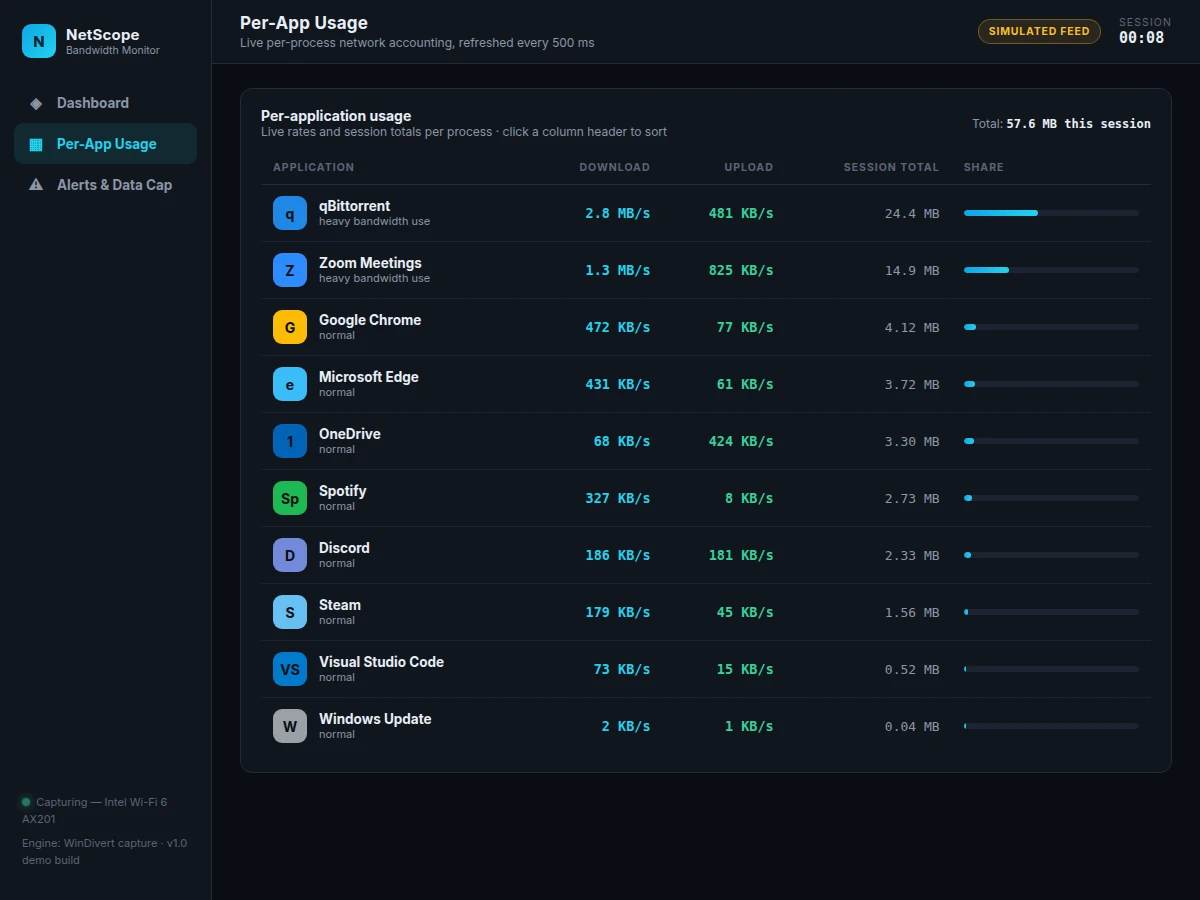
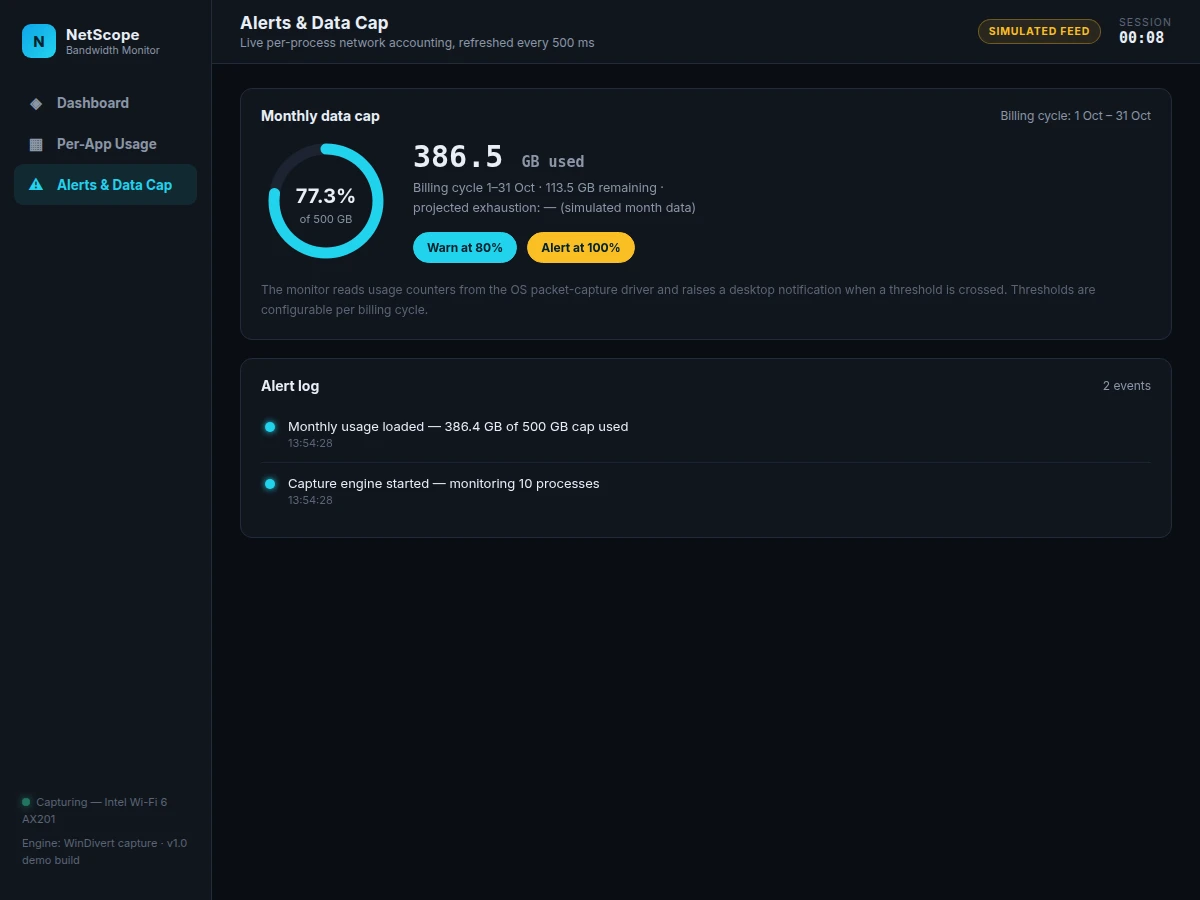
A student on a metered broadband plan or a shared lab connection can watch gigabytes disappear without ever learning which process took them — a background updater, a sync client, a browser tab, or a genuine download. The operating system exposes only aggregate counters, router pages show totals, and the built-in task manager gives coarse snapshots at best. This project closes that gap with a native Windows desktop application: a packet-capture layer attributes every byte to its owning process, an aggregation engine turns raw packets into per-second rates at a 500 ms refresh, and a dashboard renders it all as a scrolling live-throughput graph, a per-application table with live rates, session totals and share bars, plus a monthly data-cap monitor with 80% warning and 100% exhaustion alerts. Nothing is measured by hand-waving: the installer, source code, capture-driver integration notes and a buyer-run overhead measurement procedure ship with the build.
WinDivert/Npcap driver intercepting packets at the OS layer.
Follow the working sequence
How it works
- The installer registers the packet-capture driver (WinDivert or Npcap) once, with administrator rights — after install the app runs as a standard user.
- The capture thread intercepts packets at the OS layer and tags each one with the ID of the process that owns the socket.
- The aggregation engine accumulates per-process byte counts in a ring buffer and computes up/down rates over 500 ms windows.
- Every 500 ms the UI dispatcher refreshes the stat cards, appends new points to the 150-sample scrolling chart, and re-sorts the per-app table.
- Month-to-date usage is persisted to a local SQLite store keyed to the billing cycle, so the cap monitor survives restarts.
- A threshold state machine compares current usage against the configured cap and fires a desktop notification at 80% and 100%.
- Every threshold crossing, burst event and engine state change is appended to the timestamped in-app alert log.
Tech stack:
- C# · .NET 8 (WPF desktop UI)
- WinDivert · Npcap packet-capture driver
- SQLite (month-to-date usage store)
- Live charting (canvas-style plotting control)
- Windows 10 · 11 (64-bit)
- Background worker threads · lock-free ring buffer
- Windows toast notifications
- Git
| Parameter | Value |
|---|---|
| UI refresh interval | 500 ms (design target) |
| Chart history window | 150 samples, rolling 60 seconds (design) |
| Capture overhead | Below 2% CPU on a typical laptop (design target, buyer-verified with the included measurement procedure) |
| Data-cap thresholds | 80% warning, 100% exhaustion alert (configurable) |
| Installer size | Approximately 15–25 MB (expected) |
| OS support | Windows 10/11, 64-bit |
| Usage persistence | SQLite store per billing cycle |
| Payload inspection | None — headers, sizes and process metadata only |
Project features
- [Live throughput graphs] Scrolling download-vs-upload chart with a rolling 60-second window, per-second rates and auto-scaling axes — the first thing a student checks when the connection slows.
- [Per-app usage table] Every running process listed with live download/upload rates, session totals and a share-of-bandwidth bar that updates every 500 ms.
- [Session stat cards] Current download and upload rates, session peaks and cumulative session totals in four glanceable cards.
- [Data-cap monitor] Monthly allowance ring with used gigabytes, remaining quota and configurable warning thresholds (default 80% warn, 100% alert).
- [Alert log] Timestamped log of threshold crossings, traffic-burst events and engine state changes, kept in-app for the whole session.
- [Lightweight capture engine] Packet capture runs on a dedicated thread with a lock-free ring buffer; the UI refreshes on a 500 ms dispatcher so the monitor stays responsive under load.
- [Desktop notifications] Windows toast alerts when a cap threshold is crossed, so the user is warned before the allowance runs out.
What is included
- Complete C#/.NET 8 source code with installer project
- Working demo build of the desktop monitor
- Single-file interactive HTML demo (visual reference of the dashboard, graphs and cap monitor)
- Capture-driver integration and admin-install notes
- Data-cap configuration guide
- Project report PDF (capture internals, threading model, aggregation design)
- PPT presentation for final review
- Viva Q&A preparation document (packet capture, process attribution, ring buffers, OS counters)
Limitations & prerequisites
- Windows-only: the capture drivers used for per-process attribution have no equivalent path on this build for Linux or macOS.
- The capture driver requires administrator rights at install time; the app itself runs as a standard user afterwards.
- Traffic inside a VPN tunnel is attributed to the VPN process — per-app detail is lost for tunneled flows.
- The sub-2% CPU overhead is a design target, not a measured claim; the report documents the measurement procedure for the buyer to run.
- HTTPS/TLS payloads are never inspected — the monitor reads only packet headers, sizes and process metadata.
- Some system-level traffic cannot be attributed to a user process and is shown under an "unattributed" bucket.
Frequently Asked Questions
How does it know which app is using bandwidth?
The capture driver operates at the OS network layer, where every packet can be matched to the socket — and therefore the process — that sent or received it. The aggregation engine then sums those bytes per process every 500 ms, so the table shows true per-app rates rather than estimates.
Does it need administrator rights?
Only once, at install, to register the capture driver. After that the monitor runs as a standard user application with no elevation prompts.
Can it limit or block an app's bandwidth?
No — this build is monitoring-only. Per-app throttling or blocking would need a firewall-class driver and is listed as future scope in the report.
Does it read the contents of my traffic?
No. It inspects packet headers, sizes and process metadata only. HTTPS/TLS payloads are never decrypted or logged, which keeps the tool safe to run on shared machines.
What happens with VPN traffic?
Packets inside a VPN tunnel are attributed to the VPN client process, since the OS only sees encrypted tunnel traffic. Per-app detail resumes for traffic outside the tunnel.
Is this project suitable for a final-year project?
Yes — for Computer Science and IT programs. It demonstrates OS-level networking, multithreaded data pipelines, real-time visualization and a complete installable product. Suitable for B.E./B.Tech final-year projects in Computer Science, IT.
Components & software requirements
- C# · .NET 8 (WPF desktop UI)
- WinDivert · Npcap packet-capture driver
- SQLite (month-to-date usage store)
- Live charting (canvas-style plotting control)
- Windows 10 · 11 (64-bit)
- Background worker threads · lock-free ring buffer
- Windows toast notifications
- Git
Delivery information
Built-to-order project. Delivery timeline is shared after order confirmation based on current queue.
Support terms
Complete documentation, setup guide, and viva preparation included. Support for setup and explanation provided.
Download free synopsis (PDF)
Enter your name and email — the synopsis PDF downloads immediately. We may send occasional project updates; no spam, unsubscribe anytime.