
More project photos (2)
The problem
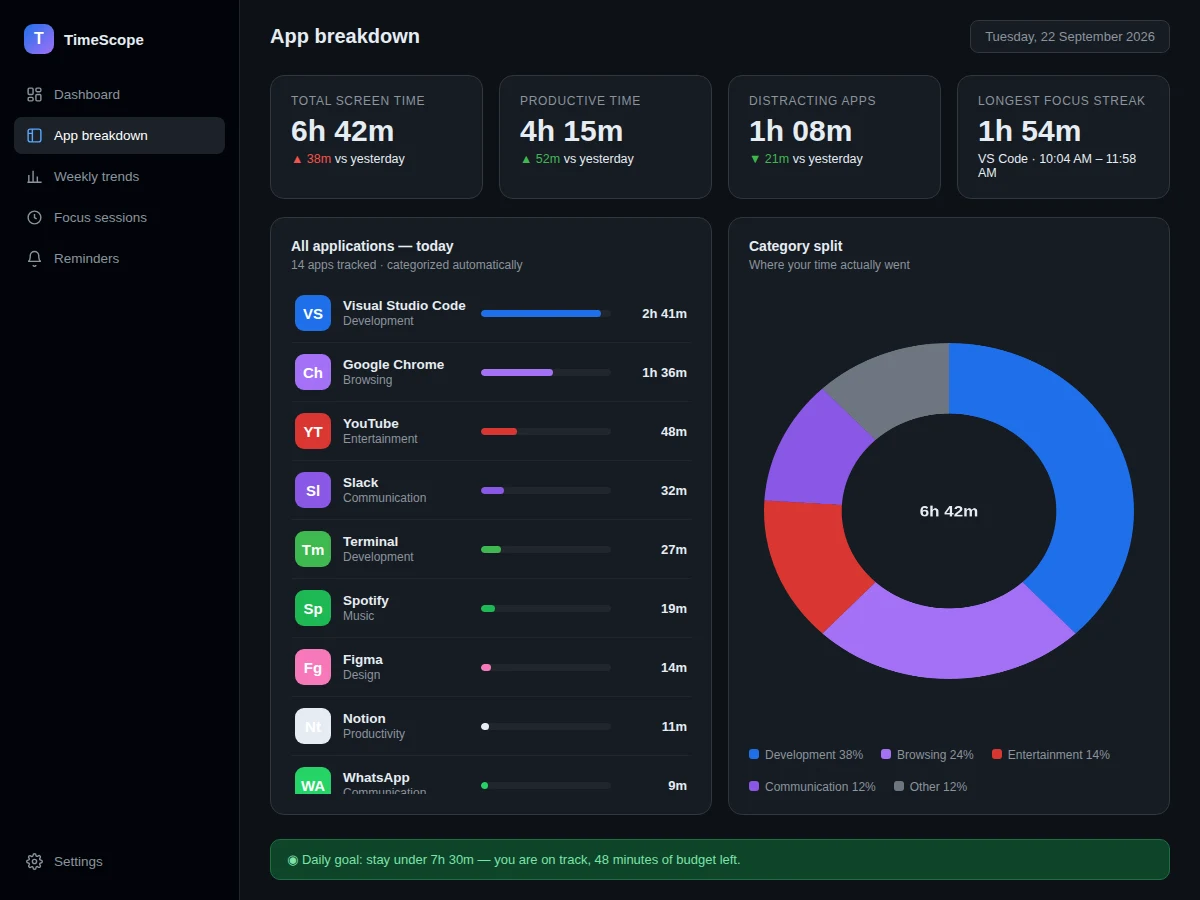
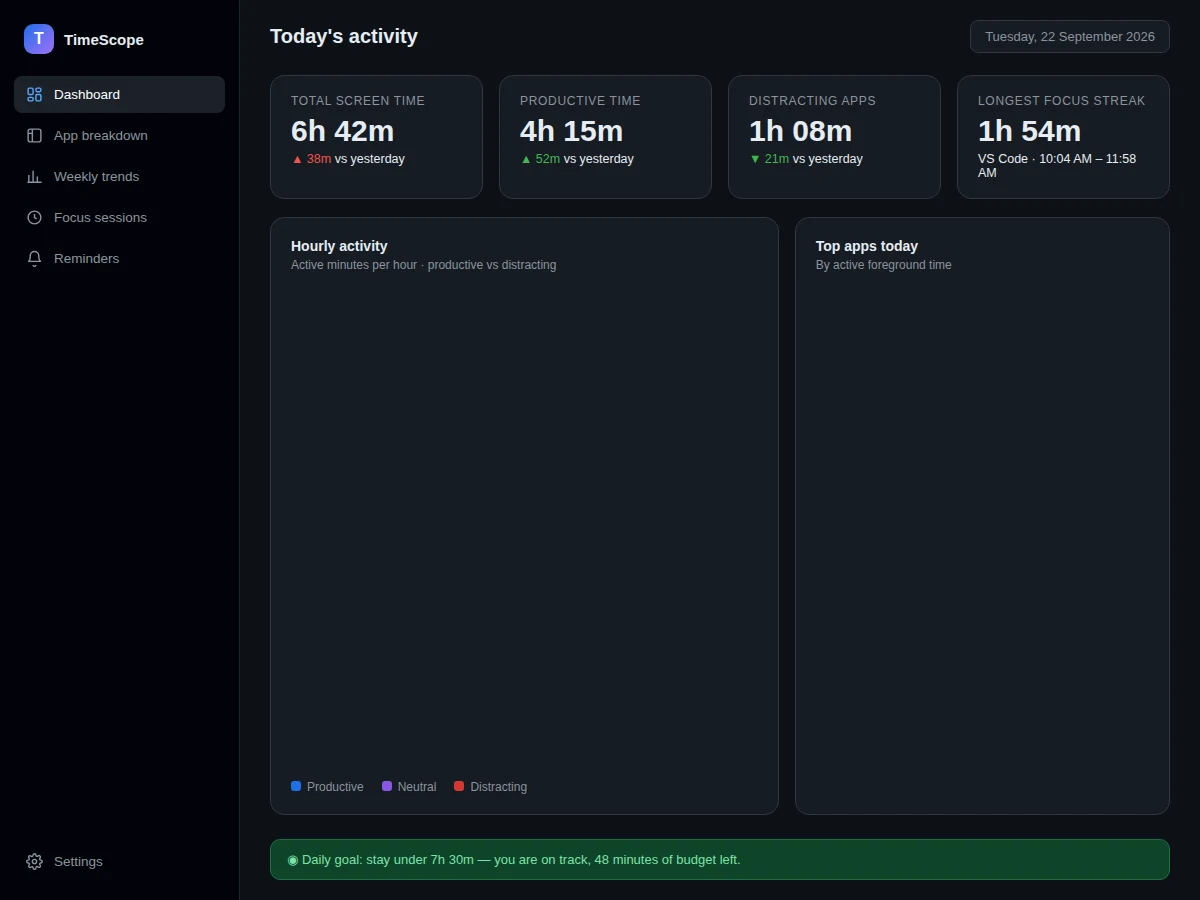
Most people dramatically underestimate their screen time and misremember where it went — "just five minutes" on a video site becomes an hour nobody can account for. Phone operating systems now ship usage dashboards, but desktops, where students and professionals do their real work, have no equivalent built in. A screen time tracker for the desktop fills that gap: it watches the active window, logs per-application foreground time, classifies apps into categories like development, browsing or entertainment, and presents the day as charts instead of guilt. This project implements that as a real desktop application with an always-on tracker service, a local analytics database, an hourly activity view, top-app rankings, weekly comparisons and configurable daily goals with reminders.
How it works
- The tracker service polls the OS for the foreground window (Win32 GetForegroundWindow, NSWorkspace on macOS, X11 _NET_ACTIVE_WINDOW on Linux) at a configurable interval, typically 5 seconds.
- Each sample is attributed to the owning process and executable; consecutive samples in the same app are merged into usage sessions with durations.
- A categorization engine matches executables against a ruleset (with user overrides stored separately) to label each session productive, neutral or distracting.
- The analytics layer aggregates sessions into hourly buckets, daily totals, per-app rankings and streak computations, all queryable from the dashboard.
- Goals are evaluated against live totals; when a distracting-category budget is nearly exhausted, a tray notification nudges the user.
- Weekly rollups compare the current week's daily totals with the previous week for the trends view.
Tech stack:
- Python 3
- PyQt6 · Qt (dashboard UI)
- SQLite (usage database)
- psutil (process attribution)
- pywin32 · pyobjc · python-xlib (OS hooks)
- Matplotlib-style custom canvas charts
- PyInstaller (packaging)
| Parameter | Value |
|---|---|
| Platforms | Windows 10/11, macOS 13+, Ubuntu 22.04+ (expected) |
| Sampling interval | 5 s default (1–60 s configurable) |
| Categories | 8 default, user-extensible |
| Data storage | Local SQLite, no network calls |
| Tracker overhead | <1% CPU typical, ~40 MB RAM (expected) |
| Retention | 12 months rolling (configurable) |
| Export | CSV per day/week/month |
| Packaging | Single-file installer per OS |
Project features
- [Foreground-window tracking] A lightweight service records the active application and window title with start/end timestamps, event-driven with near-zero idle CPU.
- [Automatic app categorization] A built-in ruleset classifies apps (development, browsing, entertainment, communication, …); users can reclassify and the rules learn from it.
- [Hourly activity chart] See the day as stacked bars of productive, neutral and distracting minutes per hour — the shape of a day at a glance.
- [Focus streak detection] Consecutive productive minutes in one app are recognized as focus sessions, with the longest streak highlighted daily.
- [Weekly trends] Day-by-day bars compare this week against last week so progress (or slippage) is visible over time.
- [Goals and nudges] Set a daily screen-time budget per category; the app warns when a distracting app eats into the budget.
- [100% local data] All tracking data lives in a local SQLite database — no accounts, no cloud, nothing transmitted anywhere.
What is included
- Complete desktop application + tracker service source code
- Installers for Windows, macOS and Linux
- Default app-categorization ruleset (editable)
- Project report PDF (OS window-tracking APIs, sessionization, analytics design, privacy model)
- PPT presentation for final review
- Viva Q&A preparation document (event-driven tracking, categorization, aggregation queries)
Limitations & prerequisites
- Tracking is per-machine; there is no multi-device aggregation in this build (listed as future scope).
- Browsers appear as one app — per-website breakdown needs a browser extension, which is out of scope.
- Full-screen games and some elevated windows may not report titles; time is still attributed to the process.
- Categorization rules cover common apps; niche or new apps start as "uncategorized" until the user labels them once.
- The 5-second sampling can miss sub-5-second window switches — an accepted tradeoff for low overhead.
- macOS requires accessibility permission; the app guides the user through granting it.
Frequently Asked Questions
Does it record what I type or what is on my screen?
No. It records only the application name, window title and timestamps — never keystrokes, never screenshots, never file contents. The privacy model is documented in the report.
Where does my data go?
Nowhere. Everything is stored in a local SQLite database on your own machine; the app makes zero network calls and needs no account.
How does it know an app is "distracting"?
A default ruleset maps common executables to categories, and you can reclassify any app with one click — your correction is remembered for future sessions.
Will it slow down my computer?
The tracker samples the foreground window every 5 seconds and idles between samples; expected overhead is under 1% CPU and roughly 40 MB RAM.
Can I export my data?
Yes — daily, weekly or monthly CSV exports are built in, so you can do your own analysis in a spreadsheet.
Is this project suitable for a final-year project?
Yes — for Computer Science and IT programs. It combines OS-level APIs, time-series data modeling, analytics and a privacy-first design story. Suitable for B.E./B.Tech final-year projects in Computer Science and IT.
Components & software requirements
- Python 3
- PyQt6 · Qt (dashboard UI)
- SQLite (usage database)
- psutil (process attribution)
- pywin32 · pyobjc · python-xlib (OS hooks)
- Matplotlib-style custom canvas charts
- PyInstaller (packaging)
Delivery information
Built-to-order project. Delivery timeline is shared after order confirmation based on current queue.
Support terms
Complete documentation, setup guide, and viva preparation included. Support for setup and explanation provided.