
More project photos (2)

The problem
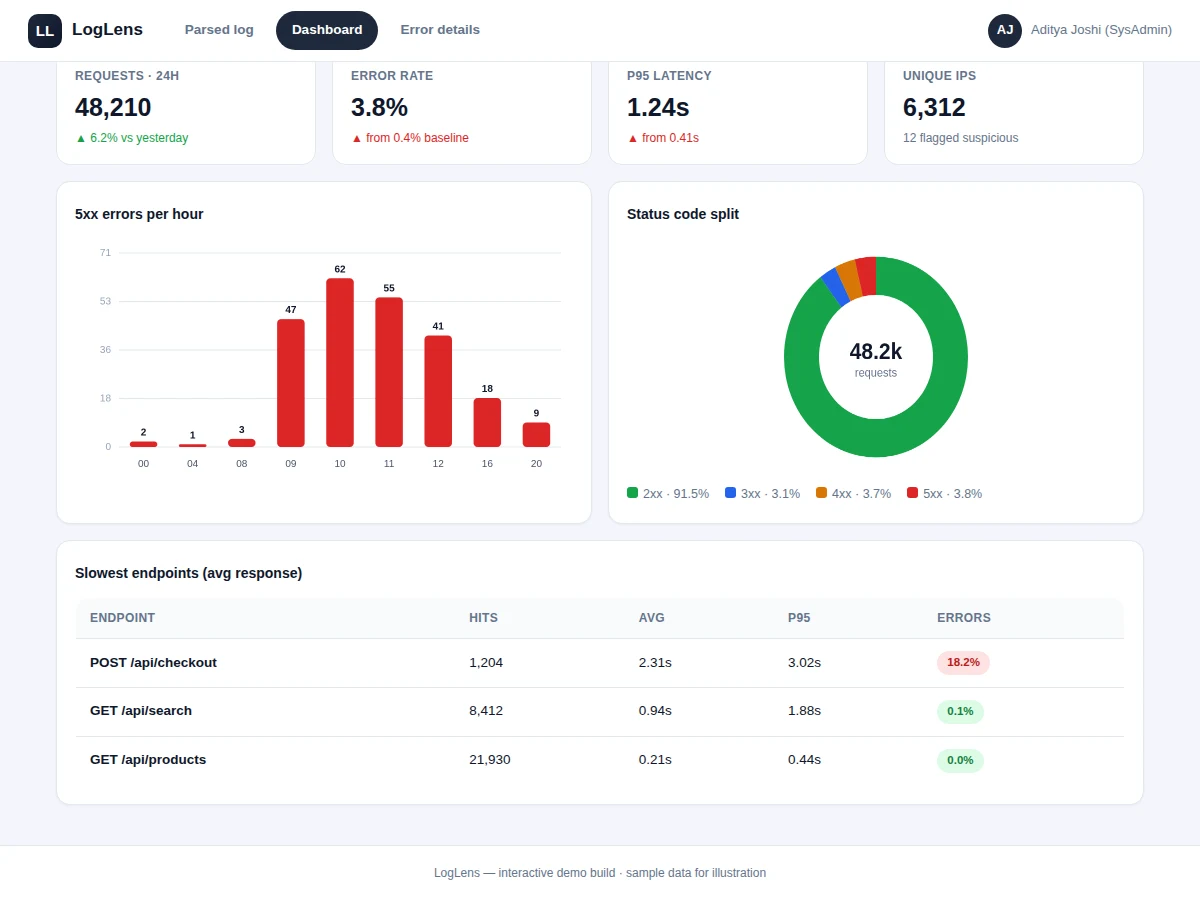
Every web server writes logs, yet most small teams read them only during outages — grepping millions of lines under pressure to answer when did checkout start failing. Enterprise log platforms are expensive and need infrastructure; the alternative is manual scanning. This project builds a focused, visual analyzer that closes the gap: format-aware parsing turns raw lines into structured records (timestamp, IP, method, path, status, latency), and a single-pass aggregation engine computes the dashboards — per-hour error series, status-code distribution, endpoint latency percentiles, IP behavior profiles — with heuristics that flag anomalies like error-rate jumps, scan-like IP patterns and the single most frequent exception collapsed into one actionable card.
How it works
- The user uploads a log file or pastes log text; the analyzer auto-detects the format.
- A streaming parser extracts fields line by line; malformed lines are quarantined and counted, not silently dropped.
- The aggregation engine computes time-bucketed counts, status histograms, endpoint percentiles and IP profiles in one pass.
- Heuristics compare error rates against a rolling baseline and flag jumps, scan patterns and slow endpoints.
- Application exceptions are fingerprinted by normalized message plus top frame, collapsing repeats into cards.
- Dashboards render charts and tables; clicking a spike or card drills down to the raw lines behind it.
Tech stack:
- Python (Flask/FastAPI) parser and aggregation engine
- HTML5, CSS3, JavaScript with canvas charts
- SQLite/PostgreSQL for parsed records
- Streaming parse for large files
- Sample log generators for demo and testing
| Parameter | Value |
|---|---|
| Formats | Nginx/Apache combined + app logs |
| Parse mode | Streaming, single pass |
| Dashboards | Error trends, status split, latency, IPs |
| Latency stats | Average and p95 per endpoint |
| Anomaly | Baseline-relative error jumps, scan detection |
| Exception grouping | Fingerprinted by message + top frame |
| Demo data | 48k-line sample Nginx log (generated) |
Project features
- [Format-aware parsing] Regex grammars for Nginx/Apache combined logs plus common app formats, with auto-detection.
- [Structured record store] Every line becomes timestamp, IP, method, path, status and latency — indexed for queries.
- [Error-trend dashboards] Per-hour request/error series with baseline comparison and spike highlighting.
- [Latency analysis] Per-endpoint average and p95 tables that surface the slowest routes instantly.
- [IP behavior flags] Request-rate and 404-ratio profiling to spot scanners and aggressive crawlers.
- [Exception grouping] Recurring stack traces fingerprinted into single cards with first/last-seen counts.
- [Drill-down] Click any aggregate to see the underlying raw log lines.
What is included
- Complete analyzer web application (upload, parse, dashboards)
- Streaming parser with format grammars
- Single-pass aggregation engine
- Sample log generator for demonstrations
- Project report PDF (parsing design, aggregation algorithms)
- PPT presentation for final review
- Viva Q&A preparation document (regex parsing, percentiles, anomaly heuristics)
Limitations & prerequisites
- The demo analyzes uploaded files; live tail/streaming mode is future scope.
- Custom log formats need a user-supplied regex; only common formats are built in.
- Anomaly thresholds are heuristic defaults, tunable per deployment, not ML-trained detectors.
- Very large files (multi-GB) need chunked upload handling beyond the demo's scope.
- Alerting (error-rate threshold to webhook) is future scope; the build is analysis-only.
Frequently Asked Questions
Which log formats are supported?
Nginx and Apache combined formats out of the box, plus common application log patterns. Anything else can be added with a custom regex grammar in the format builder.
How does it find the root cause of an error spike?
Exceptions are fingerprinted — normalized message plus top stack frame — so hundreds of occurrences of one bug collapse into a single card with first/last seen times and a suggested fix direction.
How are suspicious IPs detected?
Per-IP request rates and 404 ratios are profiled; IPs with scan-like patterns (hundreds of requests per minute, near-total 404s on admin paths) are flagged for blocking or throttling.
Does it need a server to run?
No — it is self-contained and runs on a laptop. Upload a file, get dashboards. That is the point versus heavyweight log platforms.
Is this project suitable for a final-year project?
Yes — for Computer Science and IT programs. It demonstrates parsing, streaming aggregation, percentile statistics and heuristic anomaly detection. Suitable for B.E./B.Tech final-year projects in Computer Science and IT.
Components & software requirements
- Python (Flask/FastAPI) parser and aggregation engine
- HTML5, CSS3, JavaScript with canvas charts
- SQLite/PostgreSQL for parsed records
- Streaming parse for large files
- Sample log generators for demo and testing
Delivery information
Built-to-order project. Delivery timeline is shared after order confirmation based on current queue.
Support terms
Complete documentation, setup guide, and viva preparation included. Support for setup and explanation provided.