
More project photos (3)
The problem
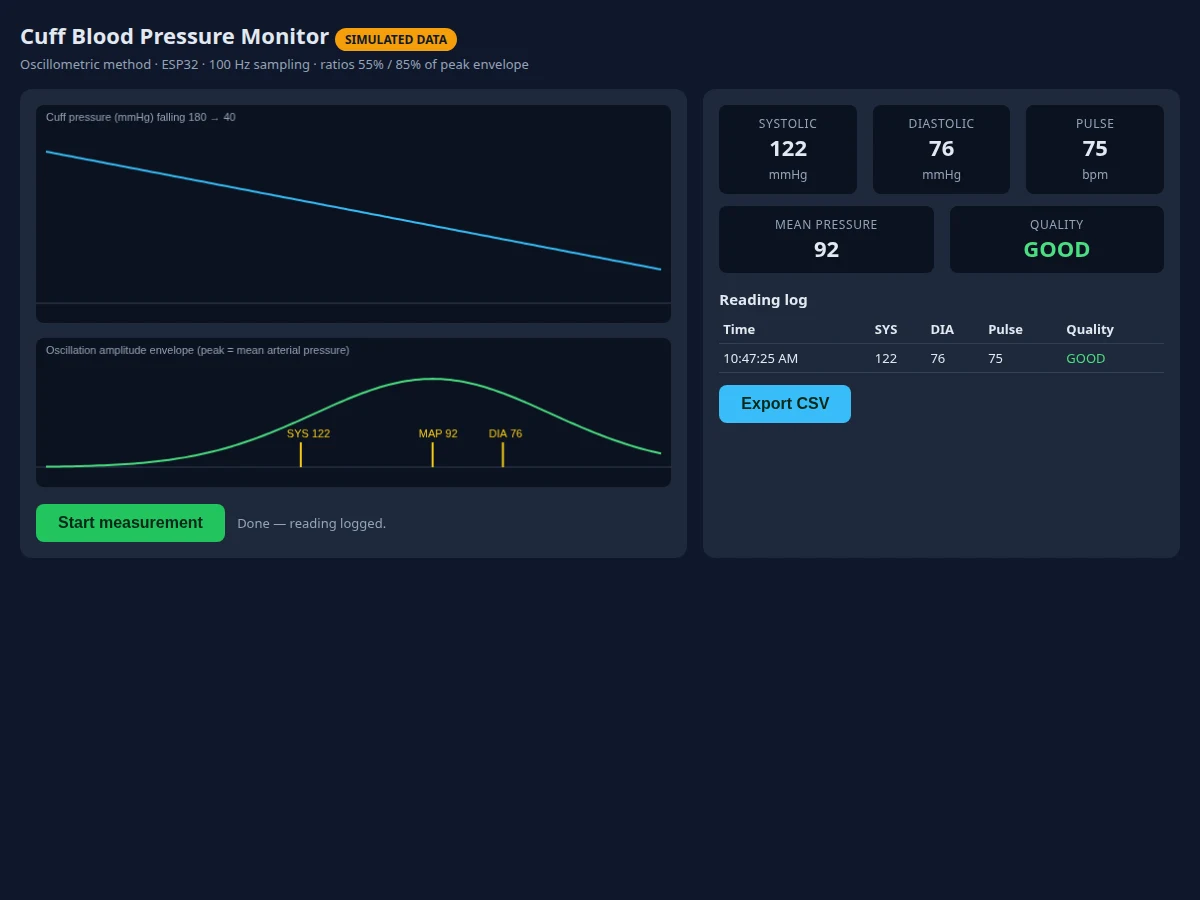
Blood pressure is one of the most measured vital signs in the world, yet most students have never seen how a monitor actually finds its two numbers. This monitor makes that measurement visible. An arm cuff inflates around the upper arm, a pressure sensor watches the cuff as it deflates slowly, and the small pressure pulses caused by blood pushing past the squeezed artery grow and then shrink into a curve called the oscillometric envelope. The point where that curve peaks gives the mean arterial pressure, and two fixed ratios along the curve give the systolic and diastolic readings. The whole process runs on an ESP32, and a local dashboard draws the cuff pressure trace, the envelope, and the final reading together, so a student can point at the exact curve that produced each number.
How it works
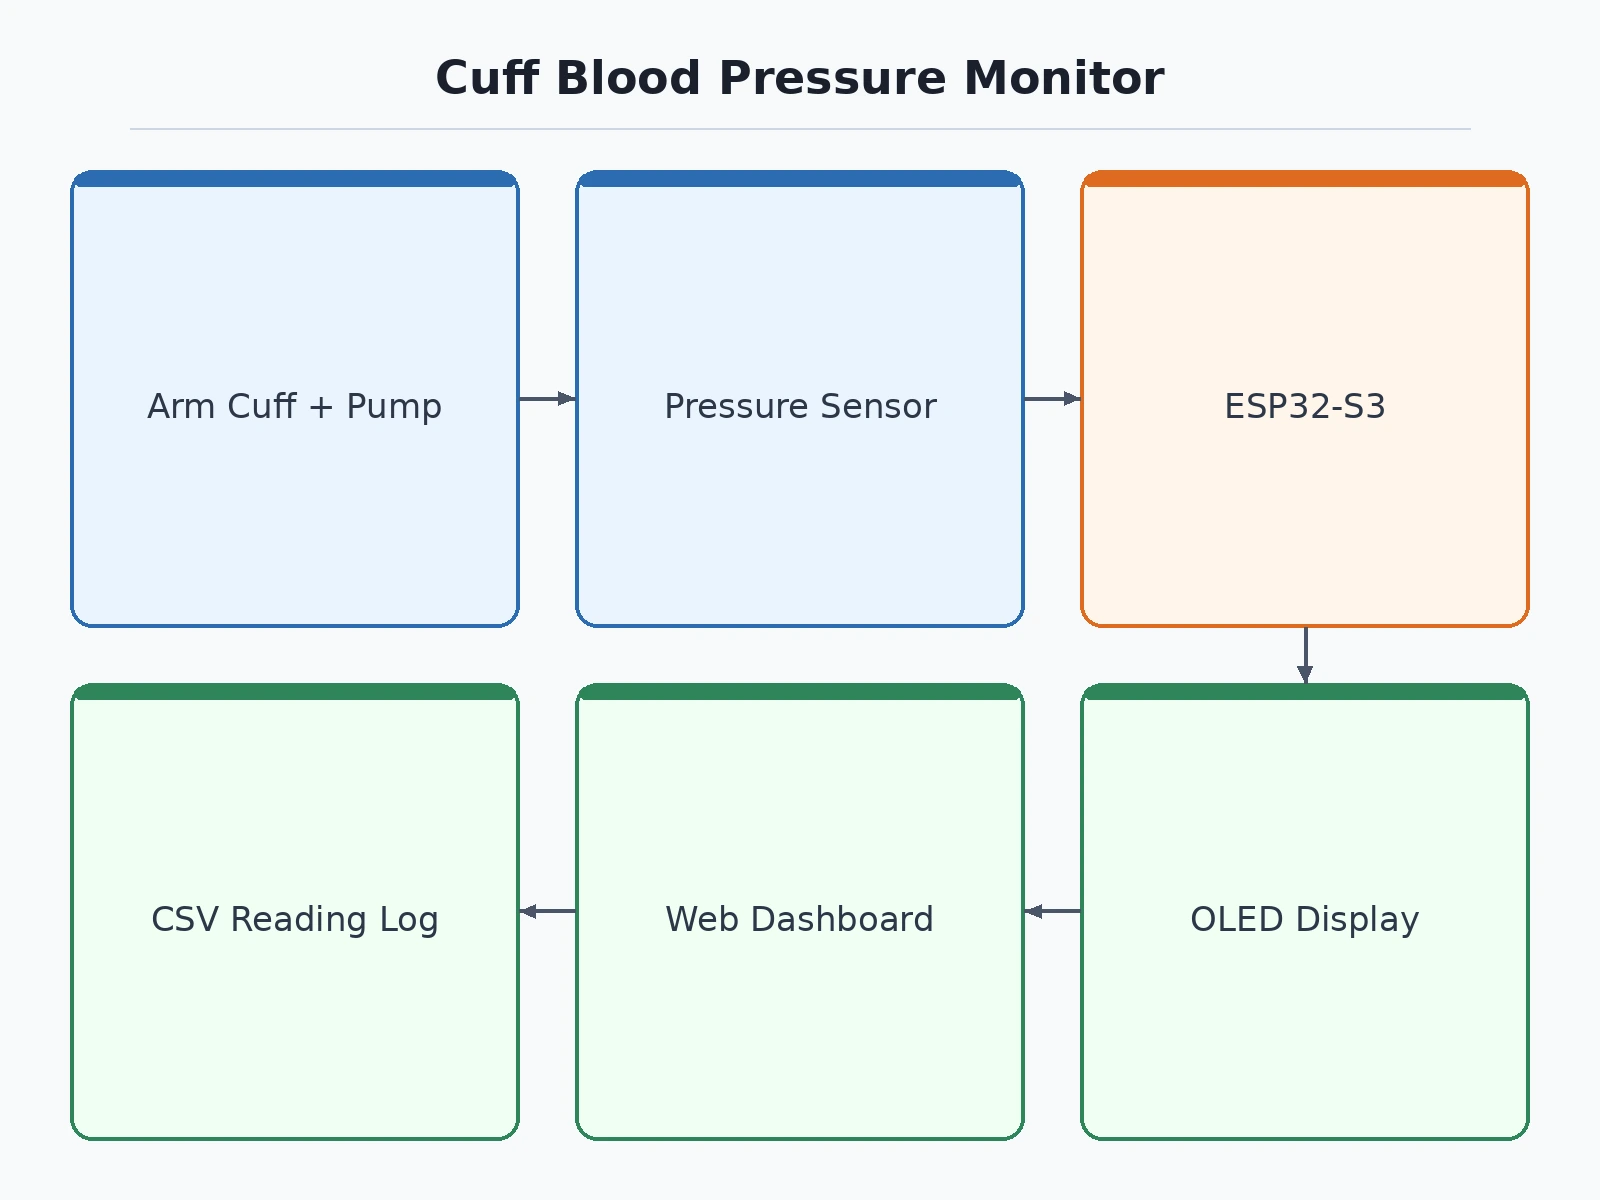
This monitor works by squeezing an artery and listening, through pressure alone, to how blood fights its way past the squeeze, in four stages that all run on the device. First, the pump inflates the cuff above the expected systolic pressure, which fully closes the brachial artery and stops the oscillation pulses. Second, the valve lets air out slowly, and as cuff pressure falls below systolic pressure, blood starts to push through in spurts, producing small pressure pulses in the cuff that grow as more blood gets through. Third, the pulses reach their largest size when cuff pressure equals mean arterial pressure, then shrink again as the artery stays open through the whole heartbeat. Fourth, the firmware reads the envelope of those pulses, marks the peak as mean pressure, and applies the systolic and diastolic amplitude ratios to report the two familiar numbers with a pulse rate counted from the pulse spacing.
- The cuff is wrapped snugly around the upper arm at heart height, with the sensor line connected to the pump, valve, and pressure sensor manifold.
- The pump inflates the cuff to a target pressure of 180 mmHg, then stops, and the firmware confirms a stable hold with no fast leak.
- The solenoid valve opens in short pulses to release air at a controlled deflation rate of about 3 mmHg per second.
- The pressure sensor samples cuff pressure at 100 Hz while the firmware high-pass filters the signal to extract the arterial oscillation pulses.
- The firmware builds the oscillation-amplitude envelope across the deflation and records the cuff pressure at the envelope peak as mean arterial pressure.
- Systolic pressure is read where the envelope reaches 55 percent of its peak on the rising side, and diastolic pressure where it falls to 85 percent of its peak on the falling side.
- The dashboard displays systolic pressure, diastolic pressure, mean pressure, and pulse rate, logs the reading with a quality flag, and the student repeats the measurement to compare readings.
Tech stack:
- ESP32-S3 microcontroller
- MPX5050 piezoresistive pressure sensor
- Mini DC air pump · solenoid valve
- Upper-arm cuff with air bladder
- OLED display module
- ESP32 web dashboard
- CSV reading log
- Rechargeable battery pack
| Parameter | Value |
|---|---|
| Controller | ESP32-S3 with dual-core Xtensa LX7 processor up to 240 MHz (datasheet value) |
| Pressure sensor | MPX5050 piezoresistive sensor · 0 kPa to 50 kPa range (datasheet value) |
| Sensor output | 0.2 V to 4.7 V analogue output at 5 V supply (datasheet value) |
| Sensor sensitivity | 90 mV per kPa typical (datasheet value) |
| Pressure unit | Readings reported in mmHg · 1 kPa = 7.50062 mmHg (conversion) |
| Sampling rate | 100 Hz cuff pressure sampling (design target) |
| Inflation target | 180 mmHg cuff pressure (design target) |
| Deflation rate | About 3 mmHg per second controlled release (design target) |
| Systolic ratio | 55 percent of peak envelope amplitude on the rising side (design target) |
| Diastolic ratio | 85 percent of peak envelope amplitude on the falling side (design target) |
| Cuff | Standard adult upper-arm cuff with air bladder (design target) |
| Display | OLED module showing live pressure and latest reading (design target) |
| Reading log | Timestamp · systolic · diastolic · mean pressure · pulse rate · quality flag (design target) |
| Export | CSV reading log (design target) |
| Operating environment | Indoor bench demonstration only · seated subject with arm at heart height (design target) |
Project features
This monitor is built around four capabilities a student can demonstrate live: an automatic inflation and controlled-deflation cycle driven by a pump and a solenoid valve, a pressure-sampling chain that separates the slow cuff pressure from the small arterial oscillations, an oscillometric algorithm that finds systolic pressure, diastolic pressure, mean pressure, and pulse rate from one deflation curve, and a local dashboard that draws the pressure trace and the envelope next to the reading. Around those core capabilities, the software keeps a reading log with timestamps and a result quality flag, exports readings as a CSV file for the report, and repeats the same measurement on demand so a student can compare consecutive readings and see real measurement variation between sittings, which turns a single number into a repeatable experiment the student can defend in review.
- [Automatic cuff cycle] A mini DC air pump inflates the cuff to a set target pressure, then a normally-closed solenoid valve releases air at a slow controlled rate, so the full measurement runs from one button press with no manual pumping. Implemented in the base prototype.
- [Oscillometric pressure sensing] A piezoresistive pressure sensor samples cuff pressure at 100 Hz, and the firmware separates the slow deflation trend from the arterial oscillation pulses riding on it. Implemented in the base prototype.
- [Systolic and diastolic detection] The firmware builds the oscillation-amplitude envelope, takes its peak as mean arterial pressure, and applies fixed amplitude ratios on the rising and falling sides of the envelope to find systolic and diastolic pressure. Implemented in the base prototype.
- [Local reading dashboard] A web dashboard on the ESP32 shows the live cuff pressure trace, the oscillation envelope, the latest reading with pulse rate, and the reading log, served over the local network with no cloud account. Implemented in the base prototype.
- [Reading log and CSV export] Every completed measurement is stored with a timestamp, systolic pressure, diastolic pressure, mean pressure, pulse rate, and a quality flag, and the log exports as a CSV file for the report. Implemented in the base prototype.
- [Measurement quality flags] A reading is flagged when the cuff leaks faster than expected, when motion corrupts the envelope, or when too few oscillation pulses are found, so a bad reading is labelled as bad instead of being reported as a number. Implemented in the base prototype.
- [Repeat-measurement comparison] The dashboard keeps the last readings side by side, so consecutive measurements on the same arm can be compared and the natural variation between readings becomes part of the demonstration. Implemented in the base prototype.
What is included
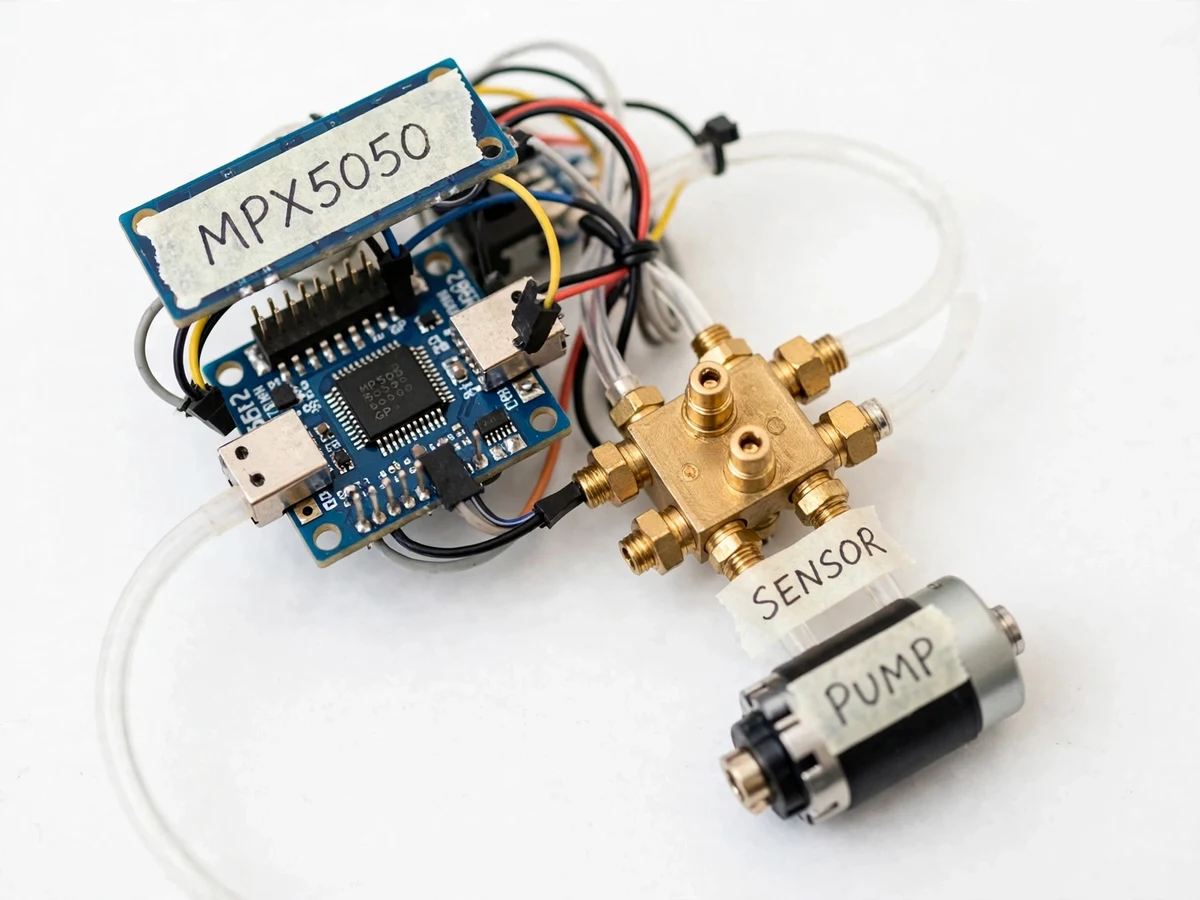
- Working prototype: ESP32-S3 controller, MPX5050 pressure sensor, mini air pump, solenoid valve, upper-arm cuff, OLED display, and battery pack, wired and tested
- Complete ESP32 firmware for inflation control, controlled deflation, 100 Hz pressure sampling, envelope detection, and the ratio-based systolic and diastolic calculation
- Local web dashboard with live pressure trace, oscillation envelope, reading display, reading log, and CSV export
- Circuit and wiring documentation with labelled connections for every wire
- Component list with the exact parts used in the build
- Calibration and demonstration procedure, including the static pressure check against a reference gauge and the repeat-measurement comparison
- Project report PDF (background, oscillometric theory, methodology, results format, limitations)
- PPT presentation for final review
- Viva Q&A preparation document (oscillometric method, envelope ratios, pressure sensor operation, pump and valve control, why a student monitor is not a medical device)
- Builder note: keep the sensor, pump, and valve manifold airtight with short tubing, because even a small leak steepens the deflation curve and shifts the envelope ratios enough to move the reported readings
Limitations & prerequisites
- The student monitor is an educational instrument, not a medical device: its readings must never be used to diagnose, treat, or monitor any health condition, and the page and the report state that boundary plainly.
- The fixed envelope ratios are a teaching approximation, not a clinical algorithm: real monitors use proprietary, population-tuned methods, so student readings will differ from a commercial monitor by several mmHg and the report must show that comparison honestly.
- Motion during deflation corrupts the envelope, so the subject must sit still with the arm supported at heart height; talking, moving, or a loose cuff produces a flagged reading rather than a trusted number.
- The build measures one arm at one sitting: it has no arrhythmia detection, no multi-reading averaging mode, and no validation against a clinical reference standard.
- Cuff size matters: a cuff that is too small for the arm reads high and a cuff that is too large reads low, so the demonstration uses a standard adult cuff on an adult arm and records the cuff size with every reading.
- The prototype is for classroom demonstration on a healthy volunteer only: it must not be used on anyone with a known circulatory condition, and any unusual reading must be checked with a proper medical device.
Frequently Asked Questions
How is this different from the wearable that inspired it?
The wearable is a miniaturised wrist device with its own sensing optics and a closed, proprietary algorithm, while the student build uses a standard upper-arm cuff, a visible pump and valve, and an open oscillometric algorithm whose envelope and ratios are drawn on the dashboard for anyone to inspect. The inspiration is the idea, everyday blood pressure tracking made accessible, not the hardware, and the page states that boundary plainly so no examiner is misled about what was built.
Is this project suitable for a final-year project?
Yes, for IoT and Embedded Systems students, because it demonstrates sensor interfacing, pneumatic control, digital filtering, and a real signal-processing algorithm in a live hardware demonstration, with a measurable test the student can repeat: inflate, deflate, read the envelope, and compare the reported numbers with a commercial monitor. The algorithm is simple enough to explain in a viva and honest enough to defend, since every reading traces back to the envelope that produced it.
Does the project need internet during the demonstration?
No, the project needs no internet at any point, because the pressure sampling, envelope detection, and dashboard all run on the ESP32 itself, and the dashboard is served over the local network to a laptop or phone in the same room. A laptop is used only to view the dashboard and to collect the exported CSV file, so the demonstration can run in any classroom with a chair and a table.
How accurate are the readings?
The pressure sensor itself resolves cuff pressure far finer than 1 mmHg, but the reading accuracy is set by the envelope-ratio approximation, not by the sensor: student readings typically differ from a commercial monitor by several mmHg, and the report must record that difference across repeated measurements rather than claiming clinical accuracy. The student verifies this by taking three readings on the same arm, noting the spread, and comparing the average with a commercial monitor reading taken in the same sitting.
Can the project be customized?
Yes, within realistic limits: a multi-reading averaging mode can be added, the envelope ratios can be retuned against a reference monitor, and a heart-rate trend chart can be added to the dashboard, while clinical validation, arrhythmia detection, and wrist-based sensing can never be added honestly, since the build has no clinical dataset, no validated algorithm, and an arm cuff rather than a wrist sensor. The report keeps that boundary explicit.
Components & software requirements
- ESP32-S3 microcontroller
- MPX5050 piezoresistive pressure sensor
- Mini DC air pump · solenoid valve
- Upper-arm cuff with air bladder
- OLED display module
- ESP32 web dashboard
- CSV reading log
- Rechargeable battery pack
Delivery information
Built-to-order project. Delivery timeline is shared after order confirmation based on current queue.
Support terms
Complete documentation, setup guide, and viva preparation included. Support for setup and explanation provided.
Download free synopsis (PDF)
Enter your name and WhatsApp number — the synopsis PDF downloads immediately. We may send occasional project updates on WhatsApp; no spam.