
More project photos (2)
The problem
This Solar Panel Performance Monitor with Voltage, Current and Temperature Logging (ESP32) records how a real solar panel behaves through the day instead of relying on the rating printed on its label. A small panel feeds a sensing circuit, an ESP32 controller reads voltage, current and panel temperature, and the readings appear on a local display and a Wi-Fi dashboard with a daily energy total. The point of the build is comparison over time: morning output against midday output, a clear day against a shaded one, and a cool panel against a hot one. Students who mount the panel, wire the sensors and watch the logged curves learn why panels with the same rating can deliver different energy on different days, and they gain a concrete dataset to discuss in a report and a demonstration. The monitor suits rooftop study, terrace experiments and laboratory benches where a panel can sit in daylight while the electronics stay sheltered.
The problem this project addresses is simple: a solar panel gives no feedback on its own. Without logged measurements, a drop in output from shading, dust, a loose connection or a hot afternoon looks identical to normal variation, and there is no record to prove which cause was at work. Multimeter spot checks catch a single moment and miss the daily shape entirely. This monitor closes that gap by sampling continuously, timestamping every sample and turning the day into a curve and an energy total that can be read at a glance.
The panel produces DC power for the monitored load path.
Follow the working sequence
How it works
The solar panel performance monitor works end to end as one measurement chain: the panel produces DC power, the INA219 module senses its voltage and current, the DS18B20 sensor reads panel temperature, and the ESP32 gathers all the readings, computes power, shows the values on the OLED display, and sends timestamped samples over Wi-Fi to the dashboard. On the dashboard the samples become a live readout, a chart of power against temperature through the day, and an accumulating energy total that resets each day. Alert thresholds watch the stream in the background, flagging low power during daylight or an overheated panel so the student checks shading, dust or wiring. Because every sample carries a timestamp, the finished day can be exported as a CSV file and analysed in the report, closing the loop from sunlight on the panel to evidence on the page.
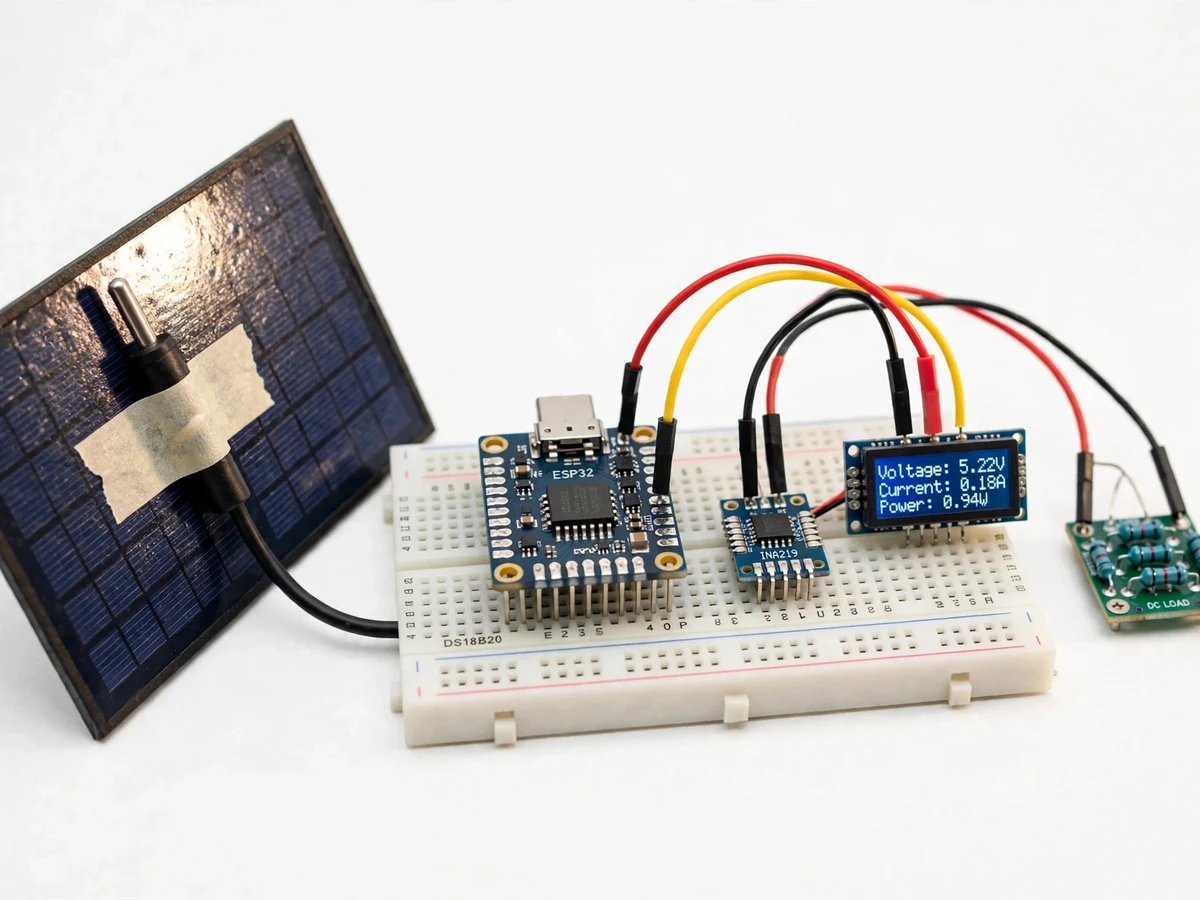
- The solar panel is connected through the INA219 sensing module to a DC load, so panel voltage and load current flow through the monitored path.
- The INA219 module measures bus voltage and shunt current digitally over I2C and reports both values to the ESP32, avoiding a separate analogue scaling stage on the main path.
- The DS18B20 sensor, fixed to the shaded back of the panel, reports panel temperature over a 1-Wire link on the same sampling cycle.
- The ESP32 reads all the values, multiplies voltage by current to obtain power in watts, and shows voltage, current, power and temperature on the OLED display.
- Samples are timestamped and stored at a logging interval of 60 seconds (design target, configurable in firmware), balancing a detailed daily curve against storage use.
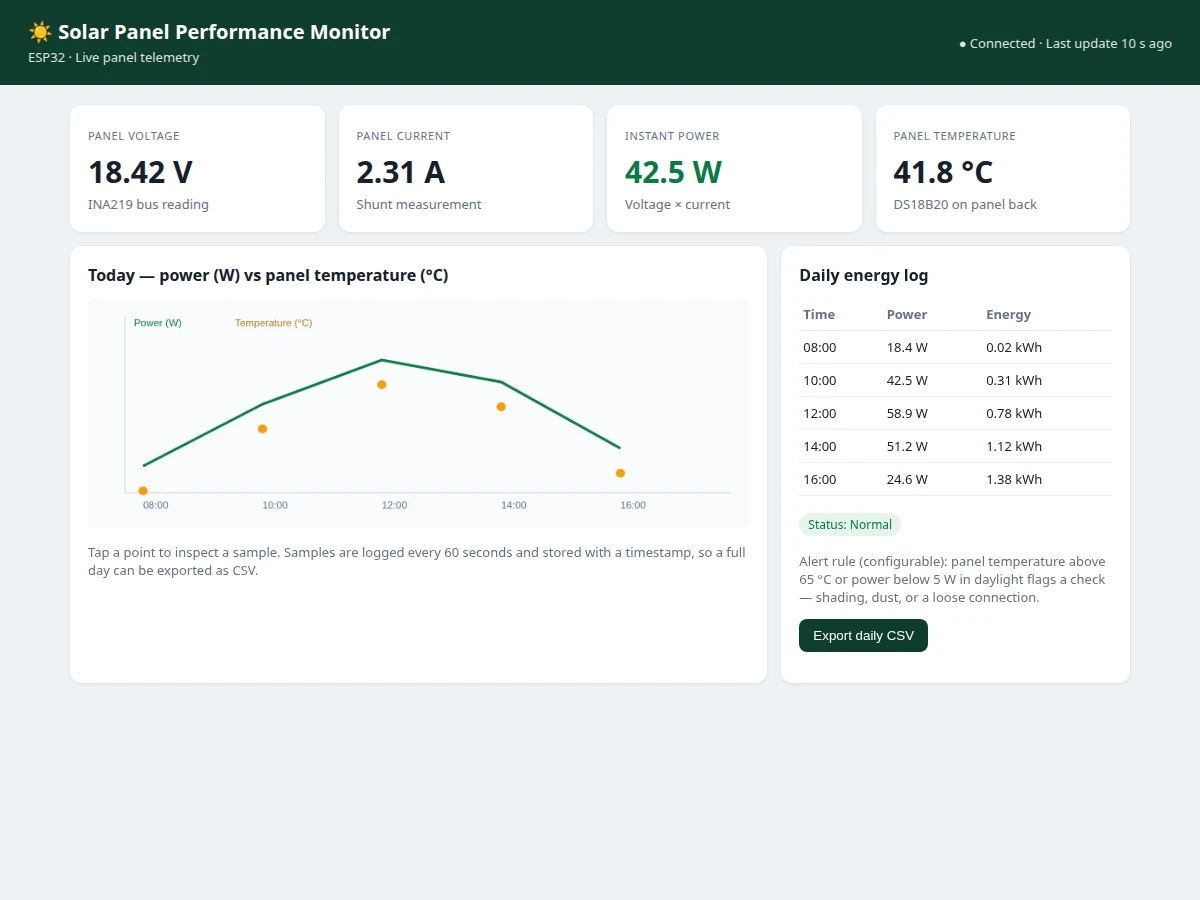
- The ESP32 serves the live readings and the daily log over Wi-Fi to the dashboard, which draws the power-versus-temperature chart and accumulates the daily energy total in kilowatt-hours.
- Configured thresholds compare each new sample against a low-power limit in daylight and a high-temperature limit, and a breach flags a check of shading, dust or wiring on the dashboard.
Builder note from the build: fix the DS18B20 probe to the shaded back of the panel, never on the sunlit face, and keep its lead away from the panel edge where wind cools it faster than the cells. A probe left in direct sun or in moving air reads its own environment instead of the panel, and the temperature curve then disagrees with the power curve for no electrical reason. During bench calibration, the resistor-divider cross-check on an ESP32 ADC1 pin is compared against a multimeter reading at different panel voltages before the ADC value is trusted; a single-point check hides a slope error that only shows up at the other end of the range. The mechanism behind the curves is first-principles and quotable: as cell temperature rises, panel voltage falls, so a hot midday panel can deliver less power than the same panel on a cooler morning even under stronger sun.
Tech stack:
- ESP32 DevKit board
- INA219 current · power sensor module
- DS18B20 temperature sensor
- OLED display module
- Arduino IDE · ESP32 firmware
- Wi-Fi dashboard · HTML · JavaScript
- CSV daily energy log
- Resistor divider · bench calibration
| Parameter | Value |
|---|---|
| Controller | ESP32 DevKit board with Wi-Fi (datasheet value: 12-bit ADC resolution, values 0–4095) |
| Voltage sensing | INA219 module (datasheet value: bus voltage range 0 V to 26 V; 12-bit ADC resolution) |
| Current sensing | INA219 shunt measurement (design target: up to 3 A with the fitted shunt) |
| Panel voltage range | Up to 24 V (design target, within the INA219 bus range) |
| Temperature sensing | DS18B20 sensor (datasheet value: range −55 °C to +125 °C; accuracy ±0.5 °C from −10 °C to +85 °C; resolution step 0.0625 °C at 12-bit setting) |
| Temperature conversion time | Up to 750 ms (datasheet value at 12-bit resolution) |
| Local display | OLED display showing voltage in volts, current in amperes, power in watts and temperature in degrees Celsius |
| Logging interval | 60 seconds (design target, configurable in firmware) |
| Dashboard | Wi-Fi dashboard with live readings, daily chart and daily energy log |
| Energy total | Daily energy in kilowatt-hours, accumulated from power samples |
| Alert thresholds | Low power in daylight and high panel temperature (configurable values in firmware) |
| Power supply | Panel output for sensing path; USB supply for the ESP32 board (design target) |
Project features
The strongest capabilities of this solar panel performance monitor are live voltage and current sensing through the INA219 module, computed power and accumulated energy, panel temperature logging through the DS18B20 sensor, and a Wi-Fi dashboard that turns timestamped samples into charts and a daily energy log. Together these give a student a complete measurement chain to build, calibrate and explain: sensing at the panel, computation on the ESP32, display beside the hardware, and storage plus presentation on the dashboard. The local OLED display keeps the build demonstrable even when the network is down, while the dashboard carries the longer story of the day. Configurable alert thresholds add a practical reason to keep watching the data, since a flagged dip invites a check of shading, dust or wiring rather than a guess.
- [Voltage and current sensing — Implemented] The INA219 module measures panel bus voltage and the current flowing through its shunt resistor over an I2C link, reporting both values digitally to the ESP32 without an analogue calibration curve on the main path.
- [Power and energy computation — Implemented] The ESP32 multiplies each voltage and current sample to obtain instantaneous power in watts, and accumulates power over time into a daily energy total in kilowatt-hours shown on the dashboard.
- [Panel temperature logging — Implemented] A DS18B20 sensor fixed to the shaded back of the panel reports panel temperature alongside every electrical sample, so temperature effects on output can be read directly from the same log.
- [Local OLED display — Implemented] A small OLED display beside the hardware shows live voltage, current, power and temperature, so the prototype can be demonstrated on a bench or terrace without opening the dashboard.
- [Wi-Fi dashboard with charts — Implemented] The ESP32 serves a dashboard over Wi-Fi showing live readings, a power-versus-temperature chart for the day and a daily energy log table that can be inspected sample by sample.
- [Timestamped logging and CSV export — Implemented] Samples are stored with timestamps at a configurable interval and can be exported as a CSV file, giving the student a real dataset for the report, graphs and analysis.
- [Configurable alert thresholds — Configurable] Thresholds for low power in daylight and high panel temperature are set in firmware, so a flagged reading prompts a physical check of shading, dust or a loose connection.
Optional customization, developed on request and not part of the base build: a GSM alert module for sites without Wi-Fi, and an SD-card logger for longer offline recording. Future scope, not included: maximum power point tracking, and comparison logging across multiple panels.
What is included
- Working prototype: solar panel with ESP32 board, INA219 module, DS18B20 sensor, OLED display and DC load wiring
- ESP32 firmware source code with sensing, power computation, display, logging and dashboard code
- Working Wi-Fi dashboard demo with live readings, daily chart and daily energy log
- Circuit and wiring documentation, including sensor placement and the bench calibration procedure
- Component list with part numbers for the controller, sensors and display
- Project report PDF (background, sensing theory, methodology, logged results and analysis)
- PPT presentation for final review
- Viva Q&A preparation document (INA219 sensing, DS18B20 communication, ESP32 ADC limits, power and energy computation)
Limitations & prerequisites
- This is an academic monitoring prototype, not a certified solar installation meter: readings support study and comparison, not billing or safety certification.
- Accuracy depends on calibration: the INA219 calibration register and the bench cross-check must be set for the fitted shunt, or current and power figures drift.
- The ESP32 ADC path is a bench cross-check only, and ADC2 pins must not be used for analogue reads while Wi-Fi is active, since the radio shares that converter.
- Temperature readings describe the sensor position on the panel back, not every cell: uneven sun or wind across the panel leaves gradients the single probe cannot see.
- The dashboard needs Wi-Fi: live remote viewing stops when the network drops, although the local OLED display keeps showing live values.
- Energy totals assume the logging interval is maintained: long power cuts leave gaps in the day, and the report must note any gap rather than present a partial day as complete.
- The prototype monitors a single small panel: multi-panel or rooftop-array comparison needs additional sensing hardware and is listed as future scope.
Frequently Asked Questions
Which controller and sensors are used?
The controller is an ESP32 DevKit board, the voltage and current sensor is an INA219 module, and the temperature sensor is a DS18B20 probe. The INA219 reports voltage and current digitally over I2C, which keeps the main sensing path free of analogue scaling errors, while the DS18B20 reports temperature over a 1-Wire link. A small OLED display shows the live values beside the hardware.
Is this project suitable for a final-year project?
Yes, it fits Electronics, Electrical and IoT programmes, and it also works for Computer Engineering students interested in embedded sensing. It demonstrates sensor interfacing, I2C and 1-Wire communication, power and energy computation, Wi-Fi dashboards and logged data analysis that gives the report real evidence. The logged dataset gives the report and demonstration real evidence to discuss.
Does the monitor work without Wi-Fi?
Yes, partially: the OLED display beside the hardware keeps showing live voltage, current, power and temperature without any network connection, so a bench demonstration never depends on Wi-Fi. The Wi-Fi dashboard, remote viewing and chart history need a network connection, so those parts pause when Wi-Fi drops. Timestamped samples already stored remain available for export once the connection returns.
What does the dashboard show?
The dashboard shows live panel voltage, current, power and temperature, a chart of power against temperature through the day, and a daily energy log. The energy log accumulates power samples into a kilowatt-hour total for the day and can be exported as a CSV file. Configured alert thresholds flag low power in daylight or a high panel temperature.
Can the project be customized?
Yes, within realistic limits: a GSM alert module can be added for sites without Wi-Fi, an SD-card logger can extend offline recording, and alert thresholds can be tuned in firmware. Multi-panel comparison and maximum power point tracking are future scope and are not part of the base build, so they would be scoped as separate work.
What power supply does the prototype need?
The sensing path runs from the panel output itself, while the ESP32 board runs from a USB supply during bench and terrace use. This split keeps the controller alive on dull mornings when the panel output is low, so logging continues even when the panel produces little power. Outdoor deployment needs weather protection for the electronics, which the base build does not include.
Components & software requirements
- ESP32 DevKit board
- INA219 current · power sensor module
- DS18B20 temperature sensor
- OLED display module
- Arduino IDE · ESP32 firmware
- Wi-Fi dashboard · HTML · JavaScript
- CSV daily energy log
- Resistor divider · bench calibration
Delivery information
Built-to-order project. Delivery timeline is shared after order confirmation based on current queue.
Support terms
Complete documentation, setup guide, and viva preparation included. Support for setup and explanation provided.
Download free synopsis (PDF)
Enter your name and WhatsApp number — the synopsis PDF downloads immediately. We may send occasional project updates on WhatsApp; no spam.