
More project photos (2)
The problem
Unplanned machine downtime is expensive, yet most small workshops cannot afford industrial condition-monitoring systems. Vibration is one of the earliest indicators of developing faults: bearing wear, imbalance and looseness all change a machine's vibration signature long before failure. TinyML makes it possible to run that analysis on a low-cost microcontroller: an ESP32 samples an accelerometer, runs a quantized neural network entirely on-device, and reports only anomalies instead of streaming raw data. This project builds that system around the MPU6050 accelerometer and a dense autoencoder trained on healthy vibration windows, with a web dashboard for live scores and event history. Because detection is unsupervised, the project needs no labeled fault recordings — the model only ever learns "healthy".
How it works
- The MPU6050 streams 3-axis acceleration to the ESP32 over I2C while the machine runs normally; firmware logs healthy windows.
- The training notebook converts windows to 24 features and trains a dense autoencoder to reconstruct healthy inputs.
- The model is quantized to int8, converted to TensorFlow Lite Micro and flashed to the ESP32 with a calibrated threshold.
- In operation, firmware extracts features per window, runs the autoencoder and computes reconstruction error as the anomaly score.
- Scores below threshold mean normal operation; crossings light the on-board indicator and publish an MQTT alert.
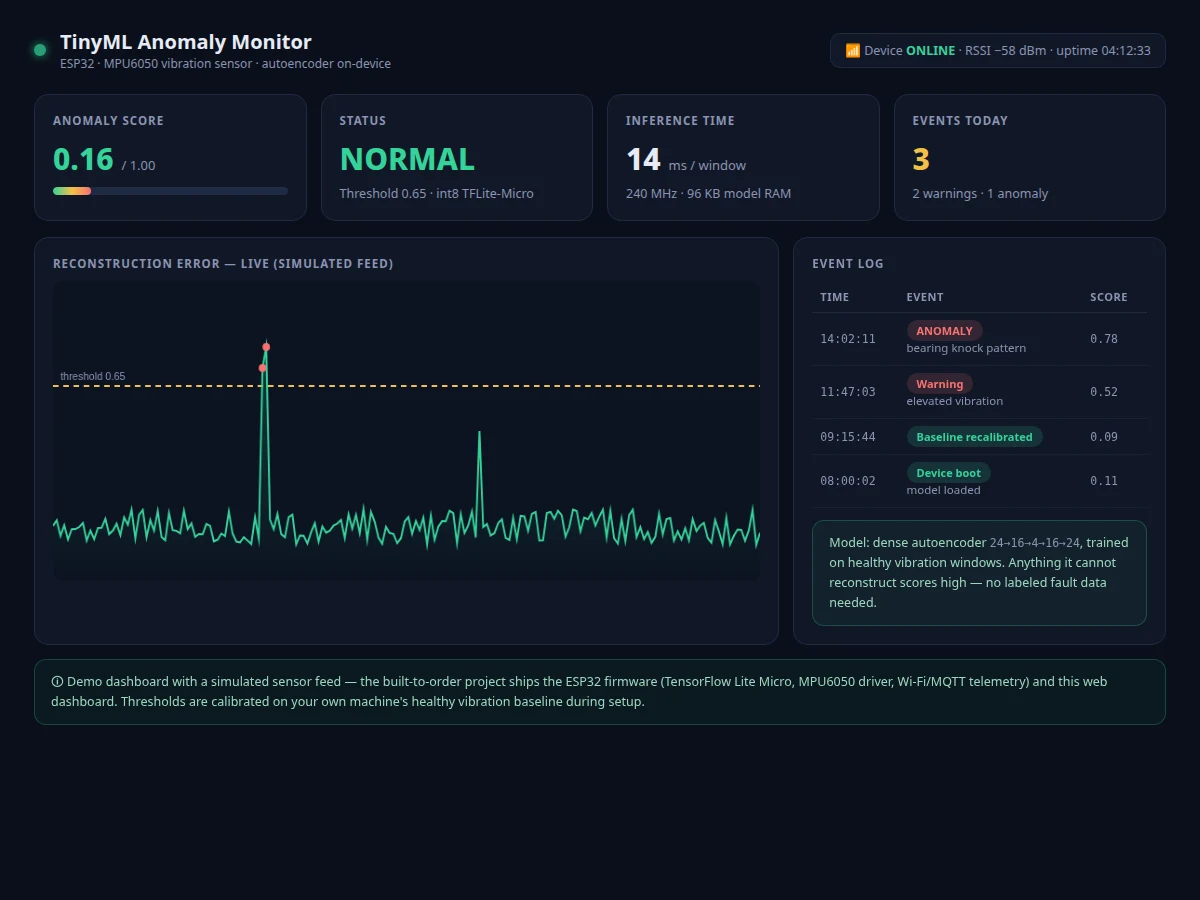
- The dashboard plots the live error curve against the threshold line and appends every event to the log.
Tech stack:
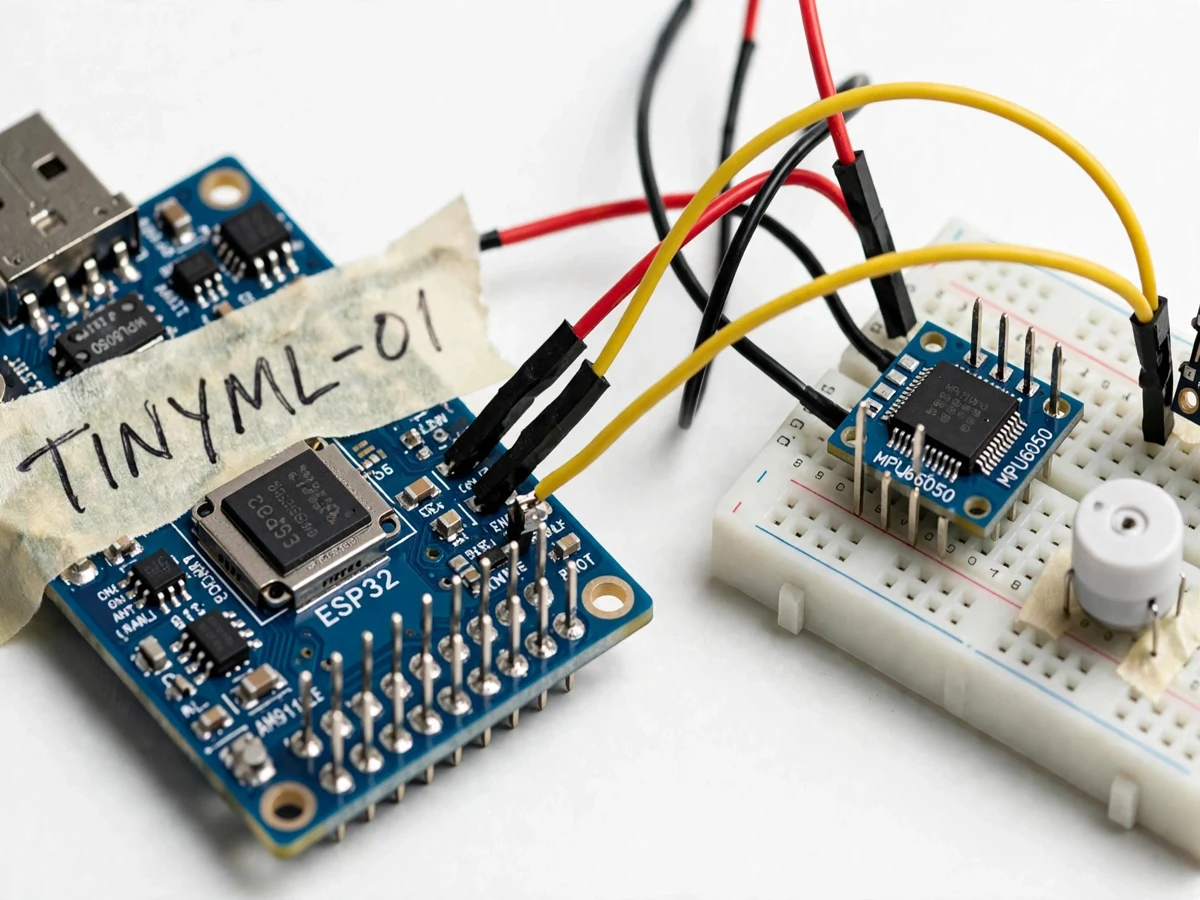
- ESP32 DevKit, MPU6050 accelerometer (I2C)
- TensorFlow Lite Micro (int8 quantized autoencoder)
- Arduino IDE / ESP-IDF (firmware)
- Python 3.10, TensorFlow/Keras (training notebook)
- MQTT (Mosquitto), HTML/CSS/JS web dashboard
| Parameter | Value |
|---|---|
| Controller | ESP32 DevKit (240 MHz dual-core, 520 KB SRAM) |
| Sensor | MPU6050 6-axis accelerometer/gyroscope over I2C |
| Model | Dense autoencoder 24-16-4-16-24, int8 quantized (TensorFlow Lite Micro) |
| Features | 24 per window: RMS, FFT-band energy, time-domain statistics |
| Inference | Design target: under 50 ms per window, under 100 KB model RAM (buyer-measured during build) |
| Detection | Unsupervised reconstruction-error scoring with calibrated threshold |
| Telemetry | Wi-Fi + MQTT to local broker; live web dashboard |
| Output | On-board indicator, optional OLED, dashboard event log |
Project features
- [On-device autoencoder inference] Quantized int8 dense autoencoder (24-16-4-16-24) running in TensorFlow Lite Micro on the ESP32, no cloud needed for detection
- [Vibration sensing pipeline] MPU6050 3-axis sampling over I2C with fixed windowing and 24-feature extraction (RMS, FFT-band energy, time-domain statistics)
- [Unsupervised anomaly scoring] Mean-squared reconstruction error as the anomaly score — trained only on healthy data, so no fault labels required
- [Live web dashboard] Real-time reconstruction-error curve with threshold line, anomaly score gauge, device status and event log
- [MQTT/Wi-Fi telemetry] Scores and window features published to a local broker; dashboard updates live
- [Threshold calibration procedure] Buyer-run routine that sets the detection threshold from the machine's own healthy baseline
- [Local alert output] On-board indicator and optional OLED display showing live status without the dashboard
- [Artificial-fault demo procedure] Documented method to introduce a controlled imbalance and watch the detector flag it
What is included
- Complete ESP32 firmware source (sensor driver, feature extraction, TFLite Micro inference, MQTT)
- Python training notebook (feature pipeline, autoencoder training, quantization, threshold calibration)
- Live web dashboard (error curve, threshold, gauge, event log)
- Wiring diagram and component list
- Project report PDF (TinyML background, model design, quantization, evaluation, honest scope)
- PPT presentation for final review
- Viva Q&A preparation document (autoencoders, quantization, I2C, MQTT, anomaly scoring)
- Setup and calibration guide (collecting baseline, setting threshold, fault-demo procedure)
Limitations & prerequisites
- Detection is only as good as the healthy baseline: if the training data includes faulty operation, the model learns it as normal — the calibration guide stresses clean baseline collection.
- The autoencoder flags that something changed, not what changed: it cannot name the fault type (bearing vs imbalance) without labeled data, which is documented future scope.
- Sensor mounting matters enormously: loose mounting or a different machine position changes the signature, so the threshold must be recalibrated per installation.
- Wi-Fi range and reliability bound the dashboard telemetry; core detection keeps running on-device even if Wi-Fi drops, but events will not reach the dashboard until reconnect.
- This is an academic prototype, not certified industrial condition-monitoring equipment.
Frequently Asked Questions
Which controller and sensor are used?
An ESP32 DevKit with an MPU6050 accelerometer connected over I2C. The ESP32 was chosen for its 240 MHz dual-core CPU and 520 KB SRAM, which comfortably fits the quantized autoencoder.
Do I need recordings of broken machines to train it?
No — that is the point of the unsupervised design. The autoencoder trains only on healthy vibration; anything it cannot reconstruct scores as anomalous. You do need a clean healthy baseline recording from your own machine.
How accurate is the detection?
There is no single accuracy number because there are no labeled fault classes in the base build. Performance is characterized by the false-alarm rate on held-out healthy windows and by the documented artificial-fault demo, both measured during your build — the report presents your numbers, not invented ones.
Does it need internet?
No. Detection runs fully on-device. Wi-Fi is only used to send scores to the local dashboard; a local Mosquitto broker on a laptop is enough.
Is this project suitable for a final-year project?
Yes — it is listed under IoT & Embedded and suits Electronics, Electrical and IoT students. It demonstrates embedded ML, quantization, sensor interfacing and MQTT telemetry.
What will I receive with the project?
ESP32 firmware, training notebook, web dashboard, wiring diagram, project report PDF, PPT, viva Q&A and the setup/calibration guide. Suitable for B.E./B.Tech final-year projects in Electronics, Electrical, IoT and related branches.
Components & software requirements
- ESP32 DevKit, MPU6050 accelerometer (I2C)
- TensorFlow Lite Micro (int8 quantized autoencoder)
- Arduino IDE / ESP-IDF (firmware)
- Python 3.10, TensorFlow/Keras (training notebook)
- MQTT (Mosquitto), HTML/CSS/JS web dashboard
Delivery information
Built-to-order project. Delivery timeline is shared after order confirmation based on current queue.
Support terms
Complete documentation, setup guide, and viva preparation included. Support for setup and explanation provided.