
More project photos (2)
The problem
After every exam, class coordinators face the same pile of manual work: marks scattered across spreadsheets, class averages computed by hand, toppers found by sorting columns, and remedial lists assembled from memory. The questions management actually asks — which subject dragged the class down, how many students failed where, whether the class improved since the last exam — get answered only after hours of brittle, one-off spreadsheet work that has to be redone differently every exam cycle. A purpose-built result-analysis dashboard turns the marksheet into a repeatable one-click pipeline: import the file, and class averages, pass percentages, grade distributions, subject scorecards and at-risk lists are computed consistently and visualized instantly. Because the whole app runs in the browser with no server, a teacher can use it on any machine with nothing installed, and no student data ever leaves the computer.
Prepares the marksheet, drops the file in Import, and filters the views.
Follow the working sequence
How it works
- The teacher prepares the marksheet with one row per student: roll number, name, division and one numeric column (0–100) per subject.
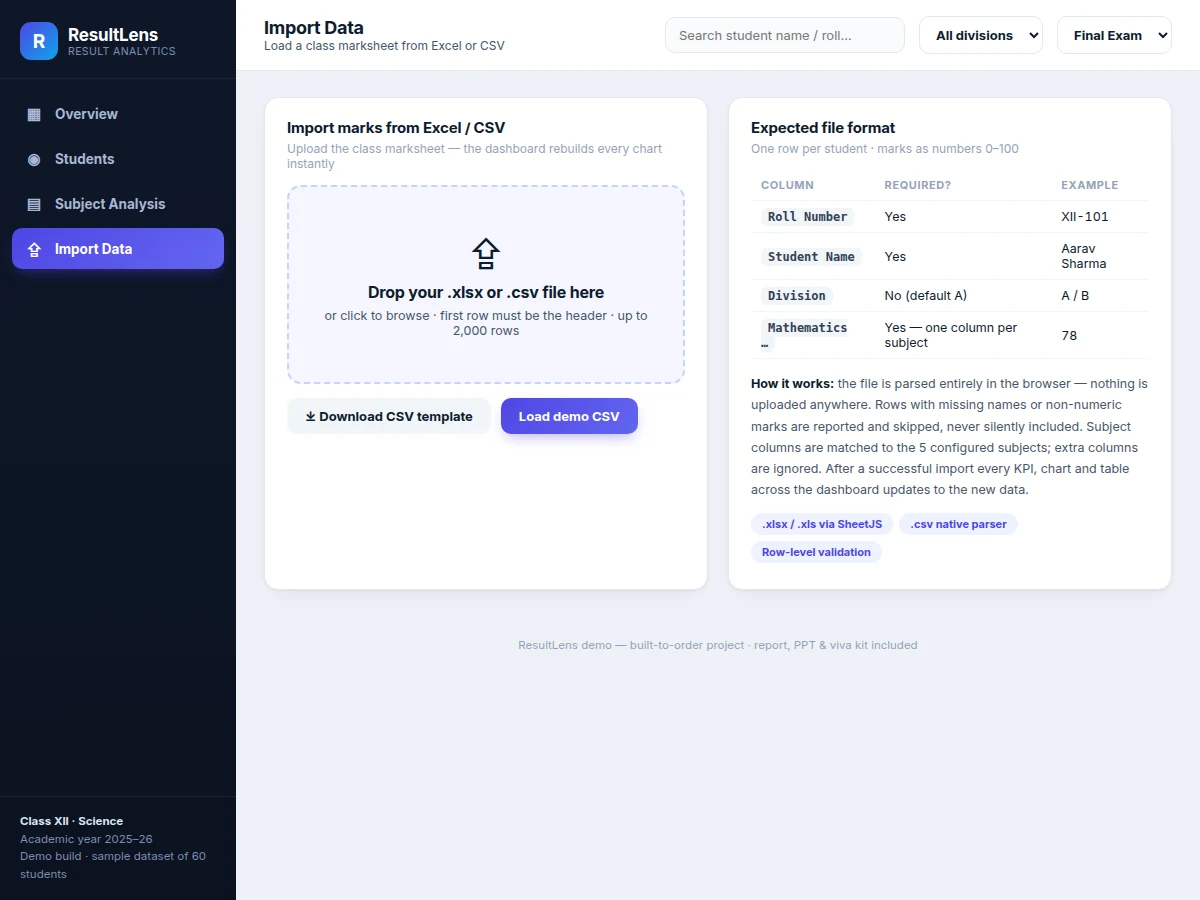
- The file is dropped into the Import view; .xlsx/.xls files are parsed with the SheetJS library, .csv files with a built-in parser — all client-side, nothing uploaded.
- Each row is validated (required columns present, marks numeric and within 0–100); invalid rows are listed with reasons and skipped.
- A preview table shows the parsed rows; on apply, the dashboard's data model is replaced and every view rebuilds.
- The analytics engine computes totals, aggregates, grades (A ≥75, B 60–74, C 50–59, D 40–49, F <40), pass flags, rankings and per-subject statistics.
- The Overview, Students and Subject Analysis views render the results as SVG/div charts, ranked tables and scorecards, with division and exam filters applying across all of them.
Tech stack:
- HTML5, CSS3, vanilla JavaScript (single self-contained file)
- SheetJS (xlsx) for Excel parsing via CDN
- Native CSV parser (no dependency)
- SVG + CSS chart rendering (no chart library)
- Seeded sample dataset (60 students × 5 subjects × 2 exams)
- Git
| Parameter | Value |
|---|---|
| App format | Single self-contained HTML file (runs in any modern browser) |
| Server required | None — fully client-side (expected) |
| Import formats | .xlsx, .xls (SheetJS via CDN), .csv (native parser) |
| Sample dataset | 60 students × 5 subjects × 2 exams, seeded and reproducible |
| Import capacity | Up to ~2,000 rows per file (design target) |
| Subjects | 5 configured (Mathematics, Physics, Chemistry, English, Computer Science) |
| Grade scale | A ≥75, B 60–74, C 50–59, D 40–49, F <40 |
| Pass mark | 40 per subject (configurable in code) |
| Data privacy | Nothing uploaded — all parsing and computation in the browser |
Project features
- [Excel / CSV import with validation] Drop a .xlsx, .xls or .csv marksheet into the import view — Excel files are parsed with SheetJS, CSV with a native parser, entirely in the browser. Rows with missing names or non-numeric marks are reported and skipped with reasons, never silently included.
- [Class overview dashboard] KPI cards (student count, class average, pass percentage, class topper), subject-average bars, a grade-distribution donut, a marks histogram, top-10 ranked table and a needs-attention list — all recomputed live from the loaded data.
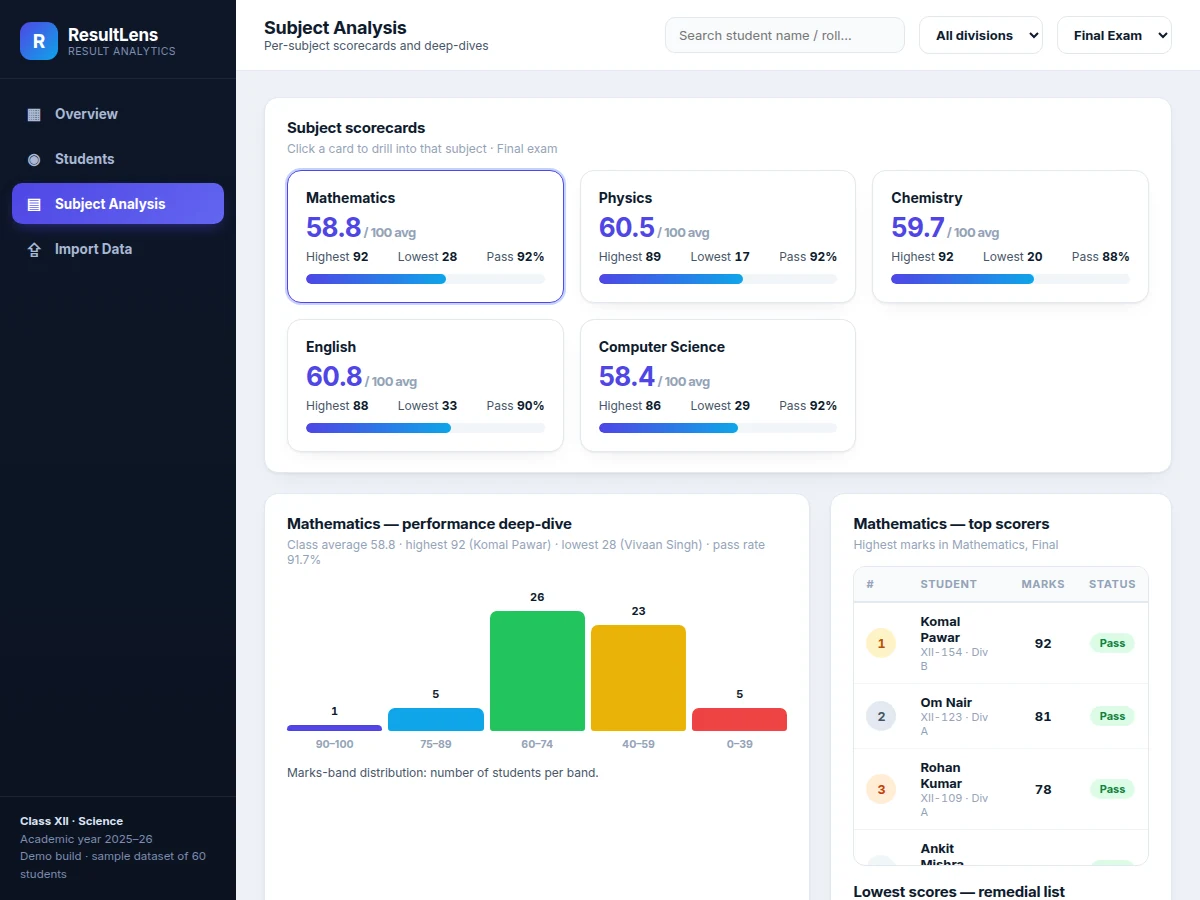
- [Subject analysis with drill-downs] Per-subject scorecards showing average, highest, lowest and pass rate; clicking a card opens a deep-dive with marks-band distribution, top scorers and a remedial low-scorer list.
- [Exam-over-exam comparison] Midterm-vs-Final subject averages side by side, so improvement or decline per subject is visible at a glance.
- [Sortable marks register] Full student table with click-to-sort columns, live name/roll search, and division and exam filters; failing marks are highlighted in red.
- [Division & exam filters] Re-scope every KPI, chart and table instantly by division (A/B) or exam, for section-wise and cycle-wise comparison.
- [Downloadable CSV template] One-click sample template matching the expected column format, so a teacher's first import works on the first try.
What is included
- Working single-file dashboard app with the 60-student sample dataset
- Excel/CSV import module with row-level validation and preview
- All four views: Overview, Students register, Subject Analysis, Import
- Documented, commented source code for the viva walkthrough
- CSV template file matching the expected import format
- Project report PDF (background, data model, parsing approach, aggregation logic, testing)
- PPT presentation for final review
- Viva Q&A preparation document (client-side parsing, data validation, chart rendering, aggregation)
Limitations & prerequisites
- Browser-only: there is no backend, so imported data lives only in the session — closing the tab returns to the sample dataset (persistence via localStorage is listed as an optional extension).
- Import is limited to the expected column layout (roll number, name, division, one numeric column per subject); differently-shaped marksheets need their columns renamed first.
- .xlsx parsing loads the SheetJS library from a CDN, so Excel import needs internet on first load; CSV import works fully offline.
- Charts are SVG/CSS-rendered, not a chart library — fine for class sizes up to ~2,000 rows, not designed for institution-scale datasets.
- Grade bands and the pass mark are fixed in code for the demo; making them user-configurable is future scope.
- No login, roles or multi-teacher data isolation — single-user tool by design.
timeline: Delivery in 5–7 working days from order confirmation: day 1–2 data-model and import module, day 3–4 analytics engine and dashboard views, day 5 charts polish and sample dataset, day 6–7 report, PPT and viva kit. Earlier delivery possible on request.
support: Explanation support over chat/call after delivery: walkthrough of the source code, how to adapt the column format to your college's marksheet, and viva preparation from the included Q&A. Bug fixes free for 30 days after delivery.
Frequently Asked Questions
How does the Excel import work?
You drop a .xlsx, .xls or .csv marksheet into the Import view. Excel files are parsed with the SheetJS library and CSV files with a built-in parser, entirely inside your browser — no server, nothing uploaded. Each row is validated (required columns, marks numeric 0–100); bad rows are listed with reasons and skipped, never silently included. A preview table appears before you apply.
What marksheet format does it expect?
One row per student: roll number, student name, division (optional), and one numeric column per subject (0–100). A downloadable CSV template ships with the project so the first import works immediately, and the expected columns are documented in the report.
Is student data uploaded anywhere?
No. The app is a single HTML file with no backend — parsing, validation and all computation happen in the browser on your own machine. Closing the tab discards the imported data (persistence is an optional extension).
Can it compare two exams, like midterm vs final?
Yes. The sample dataset includes two exam cycles, and the Overview shows Midterm-vs-Final subject averages side by side. Imported files follow the same structure, so any two exam cycles can be compared the same way.
What does the teacher actually get out of it?
In one import: class average, per-subject averages, pass percentage, grade distribution, topper ranking, a marks histogram, subject scorecards with drill-downs, and remedial-priority lists of failing students — the exact summaries coordinators otherwise build by hand each exam cycle.
Is this project suitable for a final-year project?
Yes — for Computer Science and IT programs. It demonstrates client-side file parsing, data validation, aggregation logic, dashboard UI design and chart rendering in a genuinely useful tool, with a clean viva story around every module. Suitable for B.E./B.Tech final-year projects in Computer Science and IT.
Components & software requirements
- HTML5, CSS3, vanilla JavaScript (single self-contained file)
- SheetJS (xlsx) for Excel parsing via CDN
- Native CSV parser (no dependency)
- SVG + CSS chart rendering (no chart library)
- Seeded sample dataset (60 students × 5 subjects × 2 exams)
- Git
Delivery information
Built-to-order project. Delivery timeline is shared after order confirmation based on current queue.
Support terms
Complete documentation, setup guide, and viva preparation included. Support for setup and explanation provided.
Download free synopsis (PDF)
Enter your name and email — the synopsis PDF downloads immediately. We may send occasional project updates; no spam, unsubscribe anytime.