
More project photos (3)
The problem
Retail investors in India usually track their holdings across brokerage apps, screenshots and spreadsheets, which hides the numbers that matter: the true average buy price after repeated buys, profit net of brokerage, and which positions are quietly drifting toward a stop-loss. Free screeners show live quotes but keep no personal transaction ledger, and spreadsheet P&L tends to break the first time a stock is sold partially. This project closes that gap with a desktop portfolio tracker built in Python: it fetches live NSE quotes through yfinance, stores every transaction in a local SQLite database, computes average buy price, realized and unrealized P&L and an XIRR-style annualized return, renders per-symbol price charts, and raises desktop notifications when a price hits a user-defined target or stop-loss. Because the data lives on the user's own machine, the full history survives reinstalls and needs no account or subscription. The build demonstrates genuine desktop software engineering: GUI programming, background refresh threads, local database design and third-party API integration.
The person who records trades, sets price alerts and reviews the portfolio.
Follow the working sequence
How it works
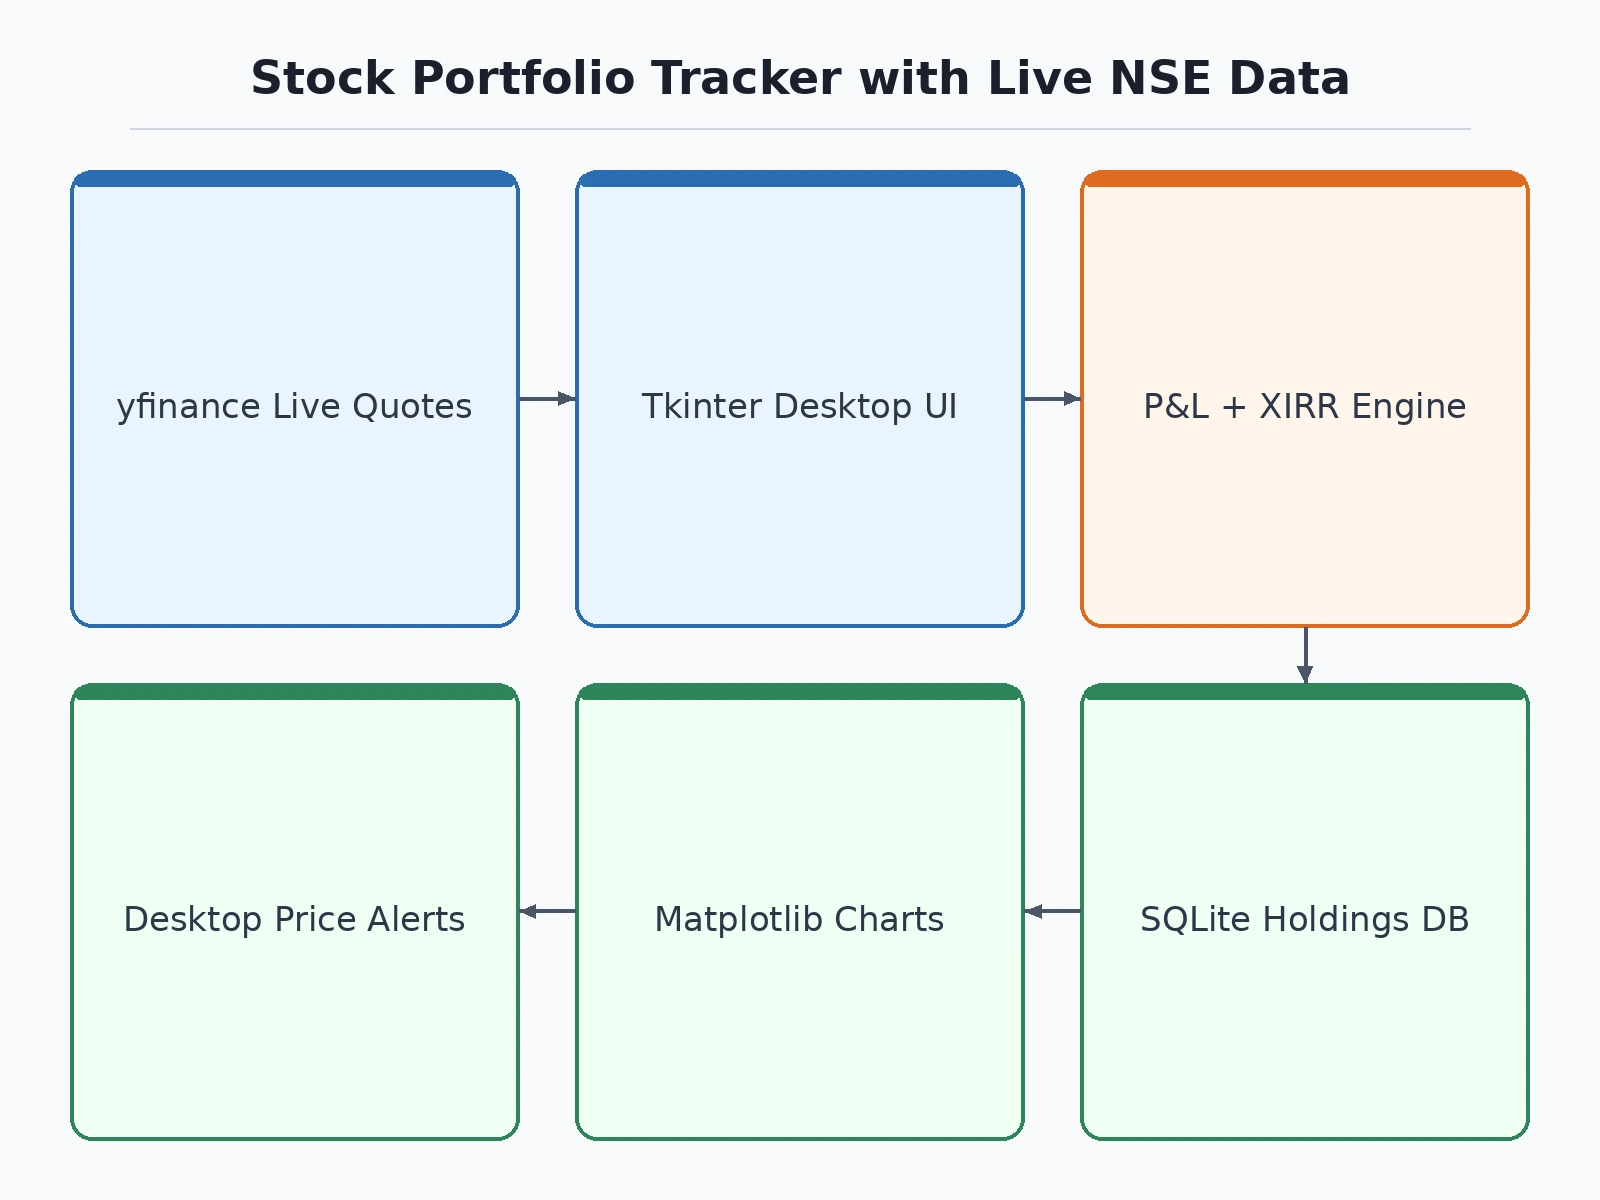
- On launch the app opens its local SQLite database and restores holdings, the transaction log and alert rules from the user's machine.
- The user records transactions (buy/sell with quantity, price, date and brokerage) or imports them from a broker contract-note CSV; each entry is appended to the ledger and holdings are recalculated.
- A background thread fetches the latest quote for every tracked symbol through yfinance (NSE .NS tickers) on the configured refresh interval, so the GUI never freezes during refresh.
- The engine marks every open position to market, recomputing average buy price, invested value, unrealized P&L, day change and the XIRR-style return over the full cash-flow history.
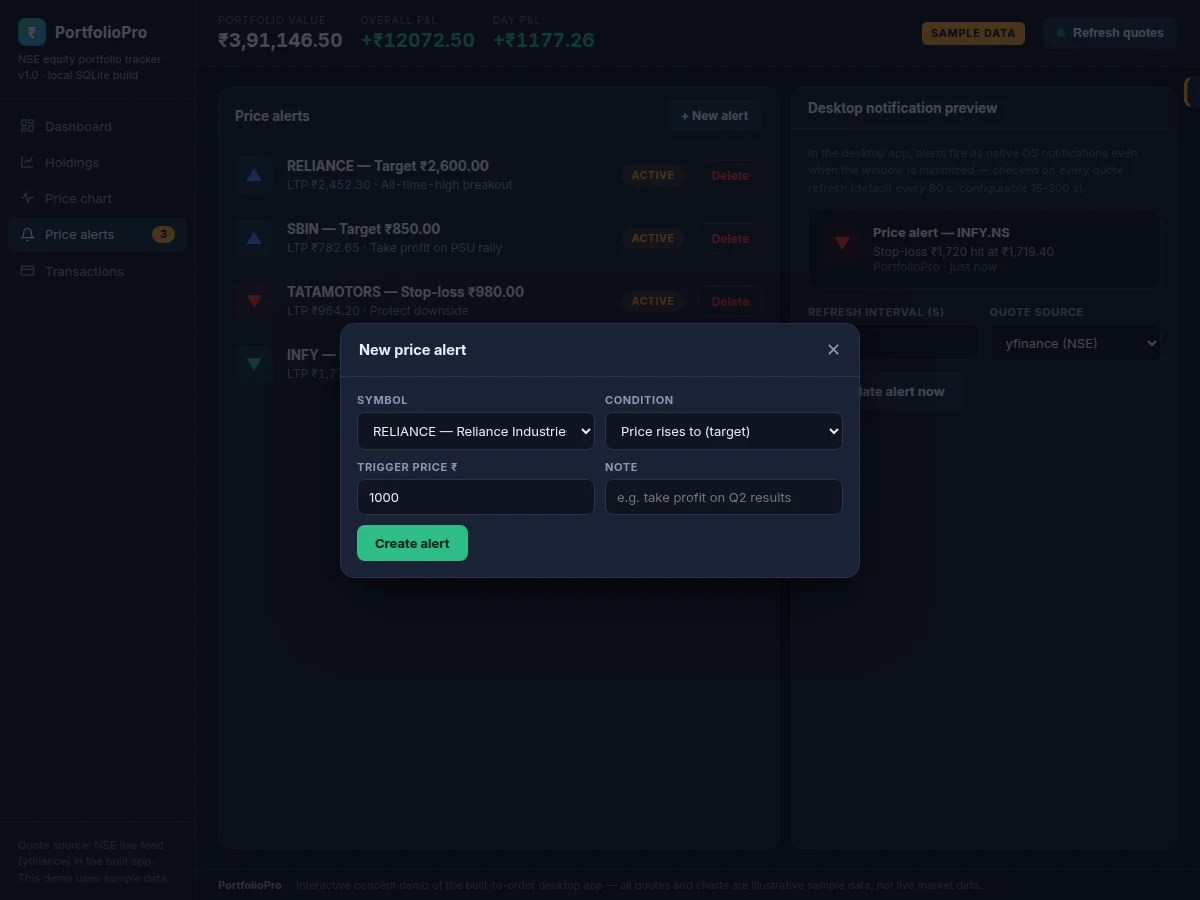
- The same refresh cycle compares each live price against the user's target and stop-loss alerts and raises a native desktop notification the moment one is hit.
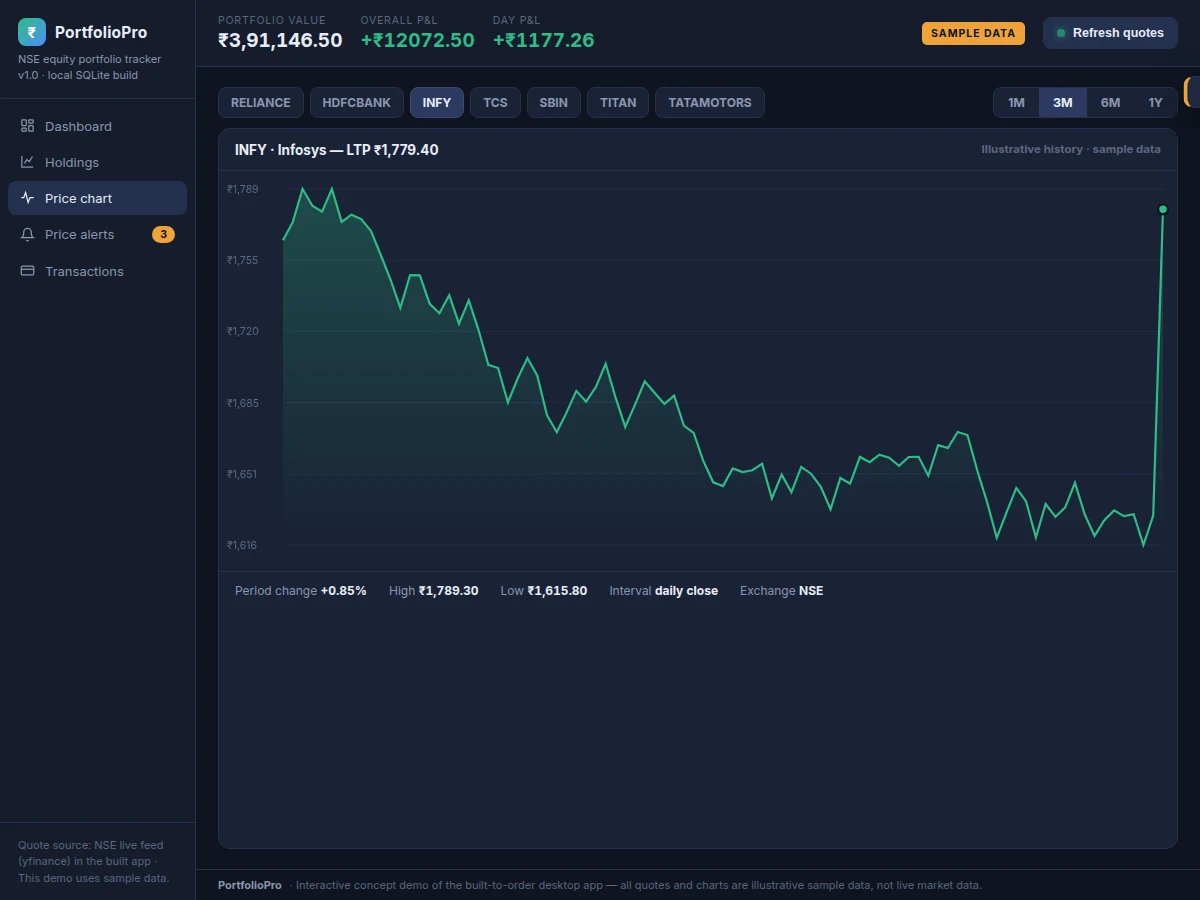
- The charts view renders the selected symbol's daily-close history with high, low and period change for the chosen 1M/3M/6M/1Y window.
Tech stack:
- Python 3, Tkinter (desktop GUI)
- SQLite (local database)
- yfinance (NSE quote feed)
- Matplotlib (price charts)
- plyer (native desktop notifications)
- pandas · CSV parsing
- PyInstaller (single-file build)
| Parameter | Value |
|---|---|
| Application type | Desktop GUI application for Windows/Linux, single-window |
| Database | SQLite file database, local to the user machine, no account needed |
| Quote source | yfinance library, NSE tickers (.NS suffix), free, no API key |
| Refresh interval | Configurable 15–300 s (design default 60 s); background thread |
| Holdings capacity | Approximately 500 symbols and 50,000 transactions (design target) |
| Price history | Daily closes, up to approximately 1 year per symbol (design target, feed-dependent) |
| Alerts | Target and stop-loss per symbol with native desktop notification |
| Import/export | CSV contract-note import (date, symbol, type, qty, price); holdings export |
| Offline behavior | Ledger, saved quotes and charts work offline; live quotes need internet |
| Packaged size | Approximately 35–60 MB single-file executable (expected, library-dependent) |
Project features
- [Live NSE quotes] Fetches refreshed quotes for every tracked symbol through the yfinance library at a configurable interval (15–300 s), showing LTP and day change on the dashboard.
- [Holdings ledger with average buy price] Each buy updates the weighted average cost of the holding; each sell reduces quantity and books realized P&L, with brokerage recorded per transaction.
- [Realized and unrealized P&L] Open positions are marked to market for unrealized P&L, while closed trades feed a realized P&L summary for the financial year.
- [XIRR-style return summary] Annualizes the complete cash-flow history of buys, sells and current portfolio value into one money-weighted return figure.
- [Target and stop-loss alerts] User-defined price levels per symbol, checked on every quote refresh; a native desktop notification fires the moment one is hit.
- [Price history charts] Per-symbol daily-close charts across 1M/3M/6M/1Y windows with period change, high and low rendered inside the app.
- [CSV contract-note import and export] Import broker contract-note CSVs (date, symbol, type, quantity, price) to bulk-load history; export the holdings ledger back to CSV.
Optional customization: multiple portfolios (family accounts) and automatic broker trade-book sync can be developed on request. Future scope: Nifty 50 benchmark comparison and dividend-income tracking are documented as future scope and are not part of the base build.
What is included
- Complete Python desktop application source code (Tkinter + SQLite)
- Sample portfolio database with realistic NSE sample holdings for demonstration
- CSV contract-note sample file and import column template
- Setup guide (Python environment, dependency install, PyInstaller build steps)
- Project report PDF (background, architecture, P&L mathematics, methodology)
- PPT presentation for final review
- Viva Q&A preparation document (SQLite schema, threading, yfinance usage, XIRR math)
Limitations & prerequisites
- Quotes come from the free yfinance feed, not an exchange-direct stream — delayed quotes and occasional feed outages are possible; it is not suitable for intraday trading decisions.
- The base build tracks equities only; F&O positions, mutual funds and dividend income are future scope.
- The XIRR figure is an annualized money-weighted return, not a promise of future performance, and is only as accurate as the transaction history entered.
- yfinance rate-limits aggressive polling, so the refresh interval cannot be set below 15 s.
- Desktop notifications need the OS notification service enabled; the app cannot send phone or SMS alerts.
- Built and tested as a desktop application; there is no mobile app in the base build (available as an optional customization).
Frequently Asked Questions
Is this project suitable for a final-year project?
Yes — for Computer Science, IT and Computer Engineering programs. It demonstrates desktop GUI development with Tkinter, relational database design in SQLite, background threading for quote refresh, third-party API integration through yfinance, financial mathematics (average cost, P&L, XIRR) and charting with Matplotlib — a full software lifecycle from schema design to a packaged executable.
Where does the live NSE data come from?
The built app uses the yfinance Python library, which serves Yahoo Finance quote data for NSE-listed symbols using the .NS ticker suffix (for example RELIANCE.NS). The feed is free and needs no API key, but it is a delayed public feed rather than an exchange-direct real-time stream — that distinction is documented honestly in the report.
How are average buy price and P&L calculated?
Each buy updates the weighted average cost of the holding; each sell reduces quantity and books the difference between the sale price and the average cost as realized P&L. Unrealized P&L is the current market value minus invested cost on open positions, and brokerage is recorded per transaction so the net figures reflect real trading costs.
Do alerts work when the app is minimized?
Yes. The quote-refresh thread keeps running while the window is minimized and checks every target and stop-loss on each cycle, raising a native desktop notification when one is hit. The interval is configurable between 15 and 300 seconds. Alerts stop when the app is fully closed.
Can it import my broker's contract notes?
Yes. The app imports CSV files with date, symbol, transaction type, quantity and price columns — the format most Indian brokers provide in contract-note or trade-book downloads. A sample CSV and column template are included, and the holdings ledger can be exported back to CSV the same way.
Components & software requirements
- Python 3, Tkinter (desktop GUI)
- SQLite (local database)
- yfinance (NSE quote feed)
- Matplotlib (price charts)
- plyer (native desktop notifications)
- pandas · CSV parsing
- PyInstaller (single-file build)
Delivery information
Built-to-order project. Delivery timeline is shared after order confirmation based on current queue.
Support terms
Complete documentation, setup guide, and viva preparation included. Support for setup and explanation provided.
Download free synopsis (PDF)
Enter your name and email — the synopsis PDF downloads immediately. We may send occasional project updates; no spam, unsubscribe anytime.