
More project photos (3)
The problem
Fertilizer and water are applied evenly across fields that are anything but even — saline patches, sandy stretches and clay pockets all get the same treatment, wasting input and yield. Precision agriculture starts with mapping the variability, and soil electrical conductivity is the standard first map: cheap to sense, strongly tied to salinity and texture. The engineering gap is a student-buildable mapper: a probe that reads EC in the soil, a GPS that tags where each reading was taken, and software that turns the point cloud into a field heatmap a farmer can read at a glance. This project builds that on an ESP32: a stainless two-probe EC sensor, a NEO-6M GPS, an LCD for field readout, and a dashboard that renders the survey grid as a color heatmap with per-point values.
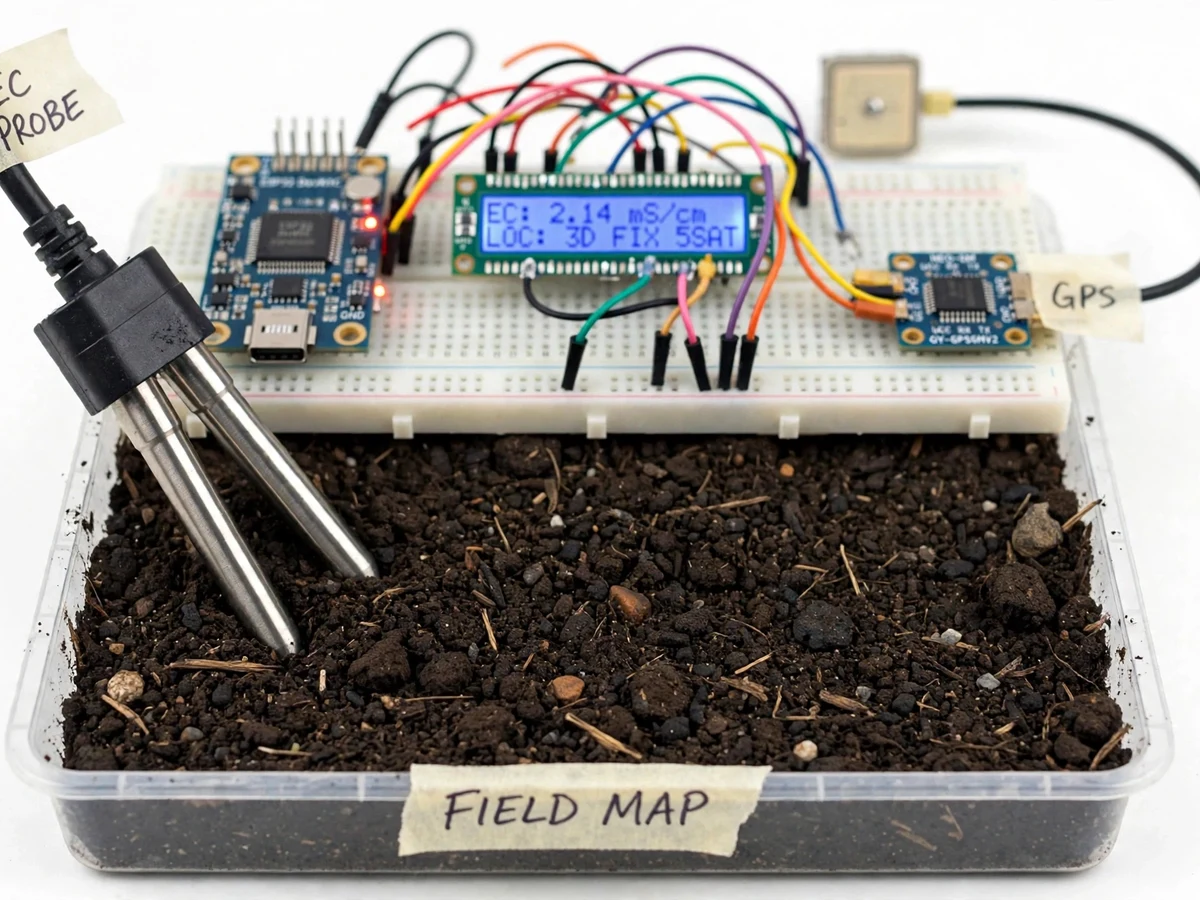
Stainless two-probe sensor measuring soil electrical conductivity at each survey point.
Follow the working sequence
How it works
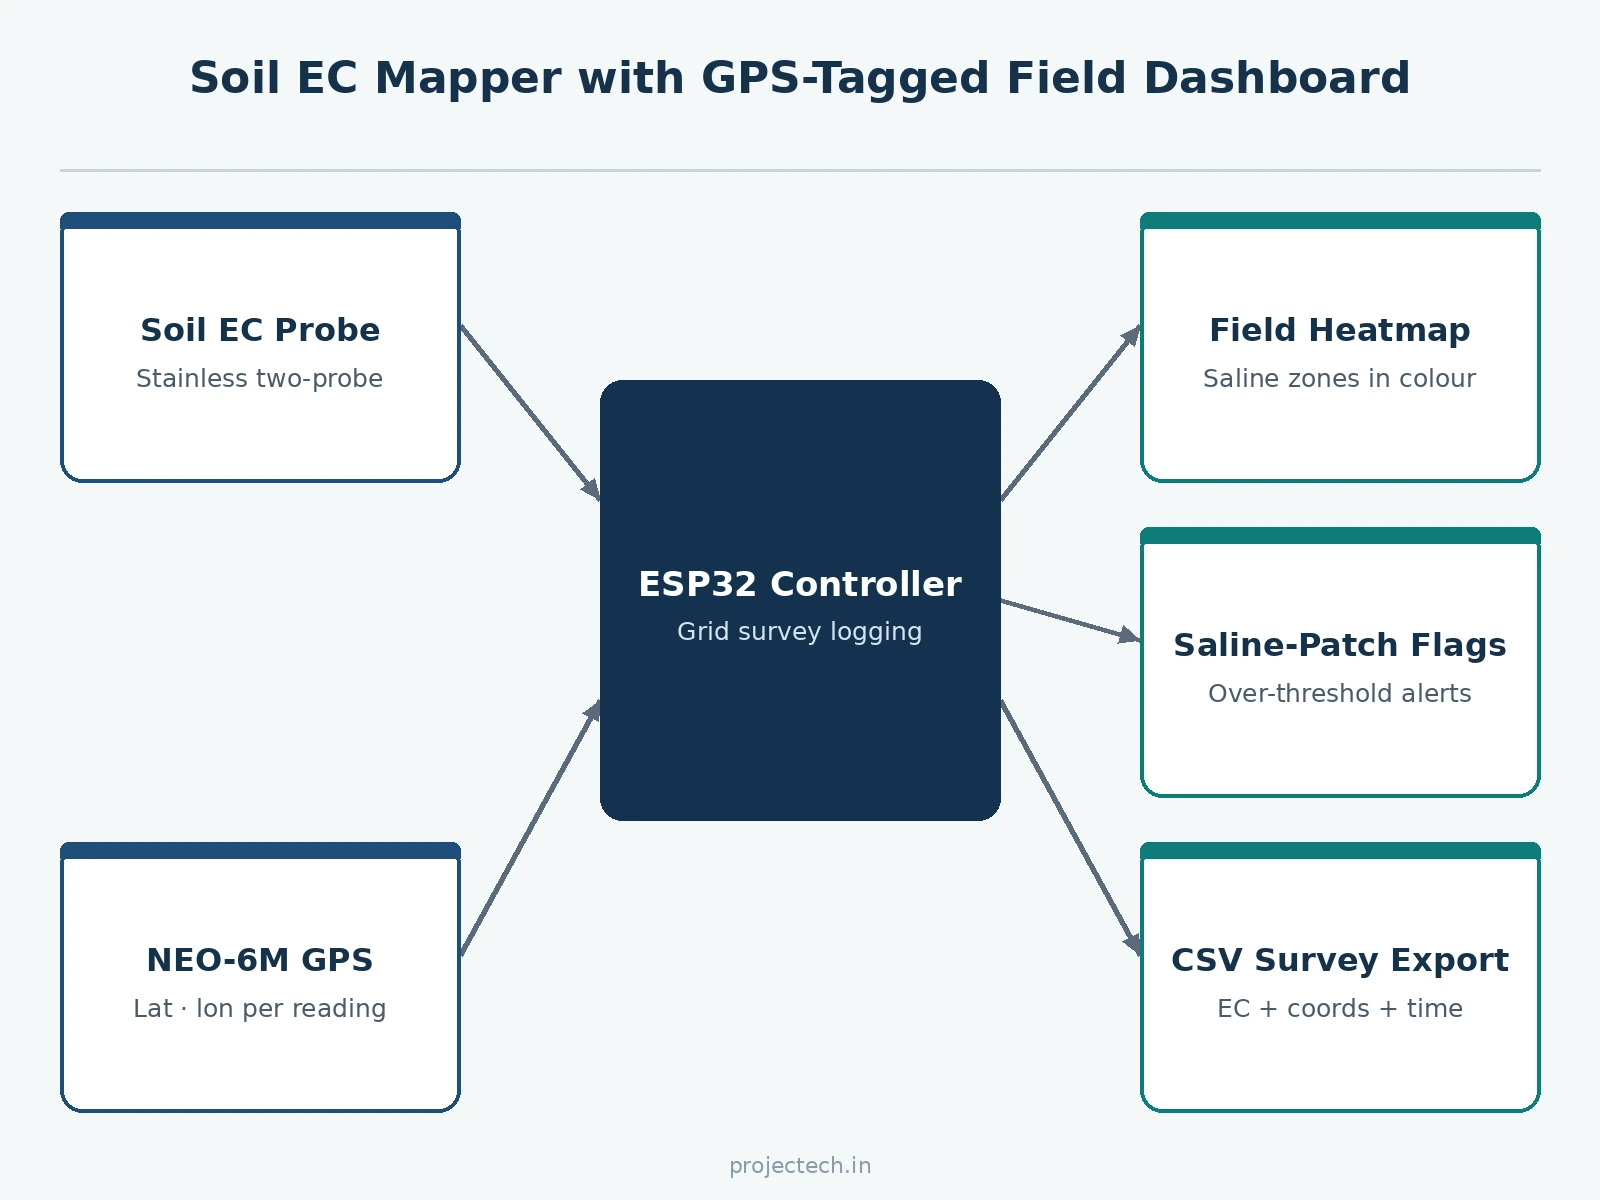
- The student walks the field grid; at each point the probe is pushed into the soil at a consistent depth.
- The ESP32 reads the EC sensor, applies the calibration constants, and captures the GPS fix.
- The LCD confirms the logged point (grid cell + EC value); the firmware advances the survey position.
- Each reading — EC, latitude, longitude, timestamp — is stored on-device and synced to the dashboard.
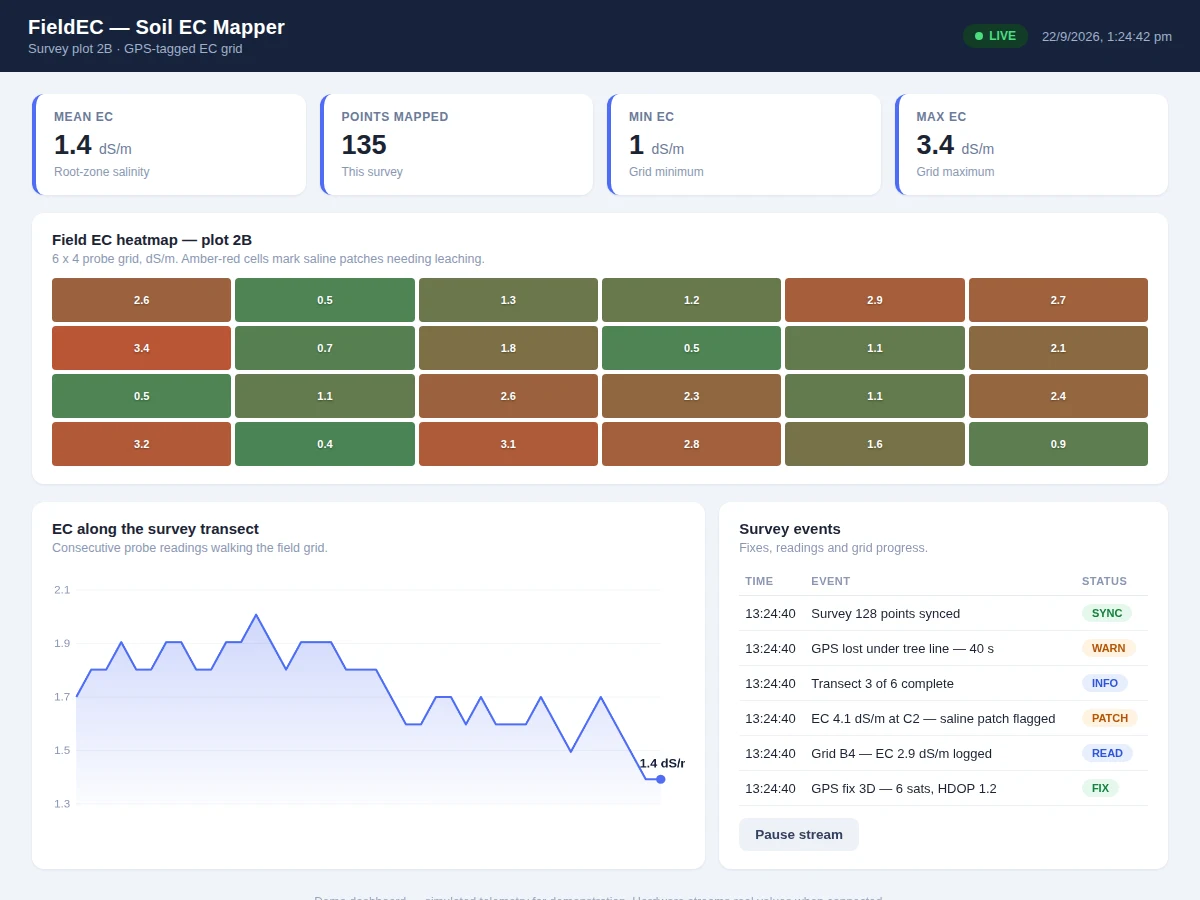
- The dashboard places every point on the field grid and colors it by EC value, building the heatmap live.
- On survey completion, the CSV exports for the report and the flagged saline patches are summarized with their areas.
Tech stack:
- ESP32 development board (field unit)
- Stainless two-probe EC sensor + interface
- NEO-6M GPS module
- 16x2 LCD (field readout)
- MicroSD card (on-device survey log)
- Soil sample tray (demo survey rig)
- Single-page field dashboard (HTML/JS heatmap)
| Parameter | Value |
|---|---|
| Controller | ESP32, on-device SD log + dashboard sync |
| EC sensor | Stainless two-probe; calibrated against KCl standard solutions at build |
| GPS | NEO-6M; open-sky fix per datasheet (actual accuracy depends on sky view) |
| Survey grid | Configurable; design default 6×4 demonstration grid |
| Flag threshold | Configurable; design default 3.0 dS/m for saline-patch flagging |
| Export | CSV: EC, latitude, longitude, timestamp per point |
| Dashboard | Live heatmap, per-point values, patch summary, transect view |
| Demo | Soil tray survey rig; real-field walks are the buyer's procedure |
Project features
- [Soil EC sensing] A stainless two-probe sensor measures electrical conductivity of the soil at each survey point.
- [GPS tagging] Every reading is stamped with latitude/longitude from the NEO-6M, so the map is georeferenced, not sketched.
- [Field heatmap] The dashboard renders the survey grid as a color heatmap — saline patches stand out immediately.
- [Grid survey mode] Firmware guides a row-by-row grid walk with the LCD confirming each logged point.
- [Saline-patch flagging] Readings above the configured EC threshold are flagged on the map for leaching or gypsum treatment.
- [Survey export] The point log (EC + coordinates + timestamp) exports as CSV for the report and for GIS tools.
- [Probe calibration] The EC probe is calibrated against standard KCl solutions by the buyer, with the procedure documented.
What is included
- Working EC mapper prototype (probe, GPS, LCD, SD logging, ESP32)
- Soil-tray demo survey rig
- Complete firmware source code (sensing, GPS tagging, grid walk, export, dashboard sync)
- Field dashboard with heatmap and patch analysis
- Circuit and wiring documentation
- EC probe calibration procedure (buyer-run KCl calibration)
- GPS field procedure (the buyer's own survey walk, documented)
- Project report PDF (soil EC agronomy, method, heatmap from the buyer's survey)
- PPT presentation for final review
- Viva Q&A preparation document (EC, salinity, GPS, calibration, precision ag basics)
Limitations & prerequisites
- EC is a proxy for salinity/texture, not a lab analysis — the report states what EC can and cannot say about the soil.
- GPS accuracy is consumer-grade (metres); the grid is a demonstration survey, not RTK precision mapping.
- Probe readings depend on consistent insertion depth and soil contact — the procedure standardizes this, but field variability remains.
- Calibration against KCl standards is required; uncalibrated readings are indicative only.
- The demo survey runs on a soil tray; a real field walk is the buyer's procedure with the same firmware.
Frequently Asked Questions
What does soil EC actually tell a farmer?
Electrical conductivity tracks dissolved salts and, indirectly, texture — high EC marks saline patches that need leaching, low EC marks sandy zones. It is the standard first map in precision agriculture.
Why tag every reading with GPS?
Without coordinates the readings are just a list. Geotagging places each point on the field so the heatmap shows where the saline patch actually is.
How accurate is the GPS?
Consumer-grade, metre-level in open sky — fine for a demonstration grid survey. RTK centimetre accuracy is listed as future scope, not claimed here.
Does the probe need calibration?
Yes — against KCl standard solutions, done by the buyer during the build. The procedure is part of the deliverables and the report records the calibration curve.
Can EC replace a soil lab test?
No, and the project does not claim it — EC maps variability so the farmer knows where to sample and where to treat, which is exactly its role in precision farming.
Is this project suitable for a final-year project?
Yes — for Electronics & Telecommunication, Electrical and IoT & Embedded programs. It combines sensing, GPS, calibration and geospatial visualization around real agricultural value. Suitable for B.E./B.Tech final-year projects in Electronics & Telecommunication, Electrical and IoT & Embedded Systems.
Components & software requirements
- ESP32 development board (field unit)
- Stainless two-probe EC sensor + interface
- NEO-6M GPS module
- 16x2 LCD (field readout)
- MicroSD card (on-device survey log)
- Soil sample tray (demo survey rig)
- Single-page field dashboard (HTML/JS heatmap)
Delivery information
Built-to-order project. Delivery timeline is shared after order confirmation based on current queue.
Support terms
Complete documentation, setup guide, and viva preparation included. Support for setup and explanation provided.
Download free synopsis (PDF)
Enter your name and WhatsApp number — the synopsis PDF downloads immediately. We may send occasional project updates on WhatsApp; no spam.