
More project photos (2)
The problem
Compressed air is one of the costliest utilities in a workshop, and a large share of it hisses out of leaking joints, worn couplings and valves left open — invisible, continuous waste. Energy audits estimate leaks with a one-time ultrasonic survey; nobody watches the system day to day. The engineering gap is continuous monitoring: line pressure on a live curve, leak rate estimated from how fast pressure decays when the plant is idle, and compressor duty cycle logged so the cost of the leaks shows up as kilowatt-hours. This project builds that on an ESP32: a pressure transducer on the ring main, a solenoid valve the firmware uses for controlled decay tests, and a dashboard with pressure curves, leak-rate trend and duty analytics.
How it works
- The pressure transducer on the ring main feeds the ESP32 a continuous pressure reading.
- Firmware logs pressure, marks compressor cut-in/cut-out transitions, and accumulates duty cycle per shift.
- During a scheduled off-hours window (or on demand from the dashboard), the controller runs a decay test: with no plant demand, it records pressure fall over a fixed time.
- The decay slope converts to an estimated leak rate using the receiver volume — documented honestly as an estimate, not a metered flow.
- Sudden daytime dips are classified as demand spikes and logged separately from the leak baseline.
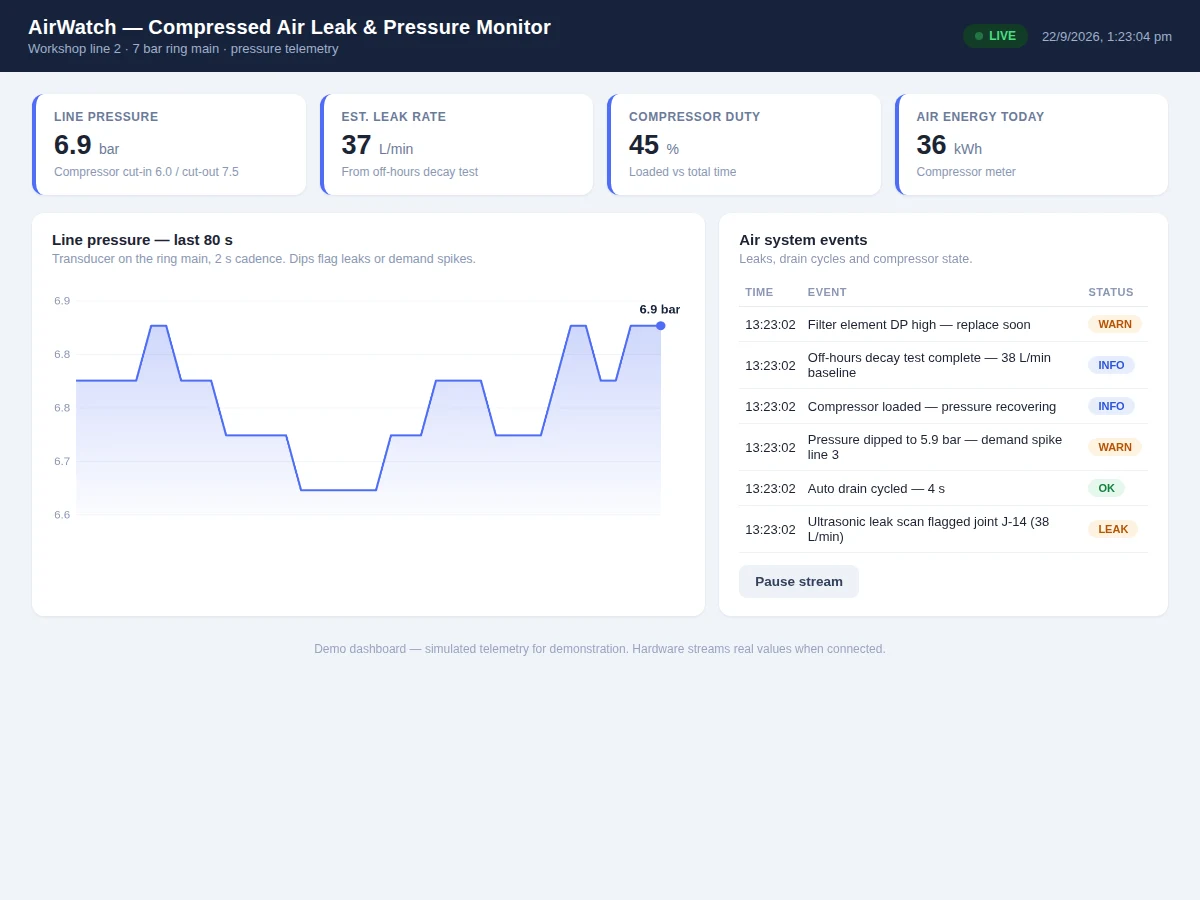
- Everything streams to the dashboard: live pressure, leak-rate trend over weeks, duty per shift and the event feed.
Tech stack:
- ESP32 development board (Wi-Fi telemetry)
- Pressure transducer (4–20 mA / 0–5 V type)
- Solenoid valve (drain + decay-test isolation)
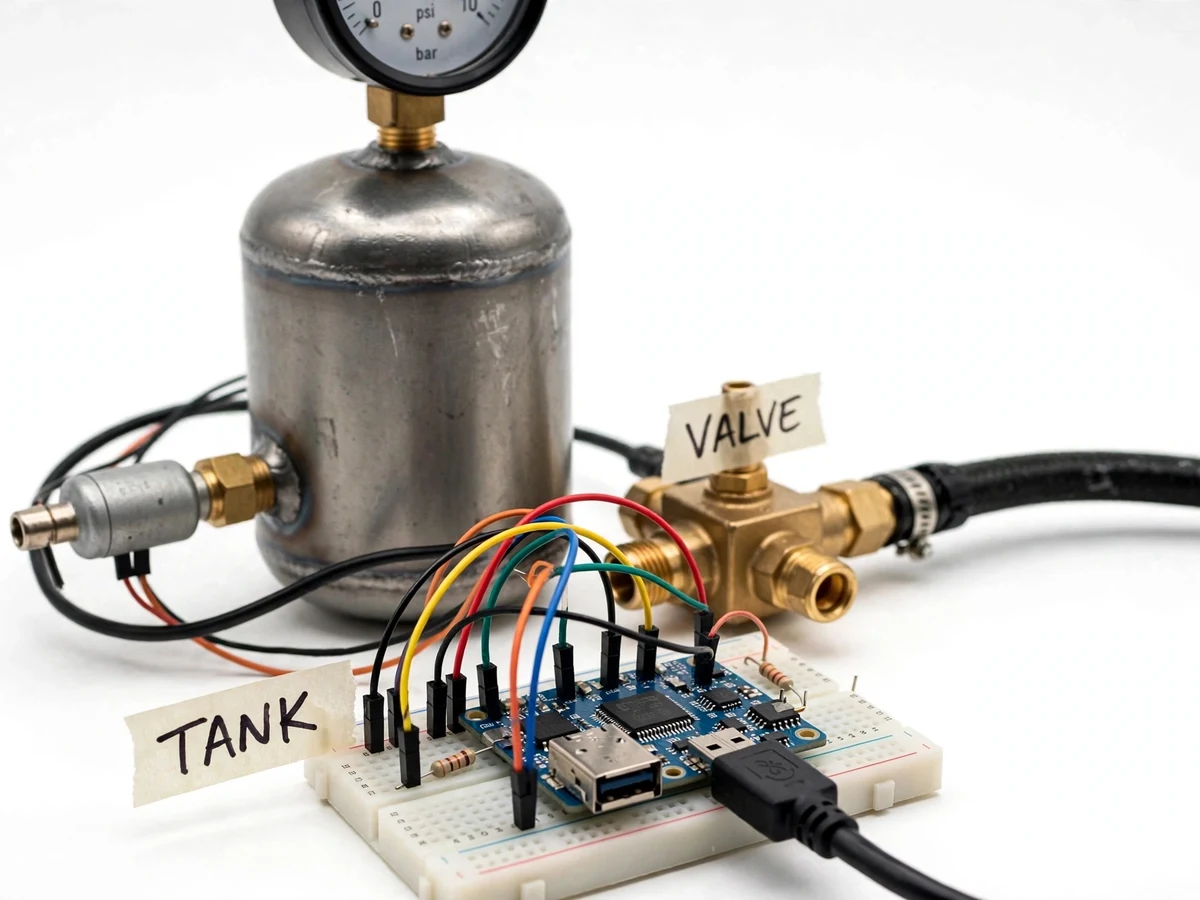
- Air receiver tank + reference pressure gauge (demo rig)
- Relay module (compressor/valve interface)
- Single-page plant dashboard (HTML/JS)
- Arduino IDE (C/C++ firmware)
| Parameter | Value |
|---|---|
| Controller | ESP32, Wi-Fi dashboard sync |
| Pressure sensing | Industrial transducer on ring main; zero/span checked against reference gauge at build |
| Line pressure | Design operating band 6.0–7.5 bar (typical workshop) |
| Leak estimation | From off-hours decay slope × receiver volume; stated as estimate, not metered flow |
| Duty logging | Loaded vs total time per shift, from pressure transitions |
| Drain | Solenoid valve, scheduled auto-drain with event log |
| Dashboard | Pressure curve, leak-rate trend, duty analytics, event feed |
| Demo rig | Bench receiver tank + gauge; full plant piping is not part of the prototype |
Project features
- [Live pressure telemetry] The transducer streams ring-main pressure to the dashboard on a continuous curve, with cut-in/cut-out events marked.
- [Leak-rate estimation] Off-hours decay tests measure how fast pressure falls with no demand; firmware converts the decay to an estimated leak rate in L/min.
- [Compressor duty logging] Loaded versus total run time is logged per shift, so rising duty at constant production points at growing leaks.
- [Demand-spike flagging] Sudden pressure dips with the compressor running are flagged as demand events versus leak signatures.
- [Auto drain control] The controller cycles a drain solenoid on schedule and logs each cycle.
- [Plant dashboard] Pressure curve, leak-rate trend, duty analytics and an event feed (leaks, drains, spikes) on one screen.
- [Calibration procedure] Transducer zero/span check against a reference gauge is part of the buyer's build procedure.
What is included
- Working air-line monitor prototype (transducer, solenoid valve, ESP32, reference gauge)
- Complete firmware source code (pressure logging, decay test, duty math, dashboard sync)
- Plant dashboard with pressure curves and leak analytics
- Circuit and wiring documentation
- Transducer calibration procedure (buyer-run zero/span check)
- Project report PDF (compressed-air economics, method, decay-test data from the buyer's run)
- PPT presentation for final review
- Viva Q&A preparation document (pressure transducers, leak estimation, duty cycle, energy cost)
Limitations & prerequisites
- Leak rate is estimated from pressure decay, not measured by a flow meter — the report states the method and its assumptions honestly.
- The decay test needs a genuine no-demand window; daytime estimates are not attempted.
- The bench rig demonstrates the method on a small receiver; plant-scale piping is out of scope for the prototype.
- Transducer accuracy depends on the buyer's zero/span calibration against the reference gauge.
- Energy-cost figures in the dashboard are computed from duty and nameplate power — indicative, not sub-metered billing data.
Frequently Asked Questions
How can pressure decay tell you the leak rate?
With no demand, the only way air leaves the receiver is through leaks. The pressure fall over a fixed time, multiplied by the known receiver volume, gives the leaked volume per minute — a standard audit technique.
Why run the test off-hours?
Any plant demand during the test looks like a leak. The firmware schedules decay tests for idle windows so the estimate reflects leaks only.
How do you separate leaks from real demand?
Leaks are the steady baseline from the off-hours test; sudden daytime dips while production runs are logged as demand spikes. The dashboard shows both.
Is the leak number exact?
No — it is an estimate with stated assumptions (receiver volume, temperature stable). The report documents the method rather than pretending it is a calibrated flow meter.
What does the dashboard show a plant engineer?
Live pressure with cut-in/out marks, leak-rate trend over weeks, compressor duty per shift and an event feed — enough to justify fixing the worst joints first.
Is this project suitable for a final-year project?
Yes — for Electronics, Electrical and IoT & Embedded programs. It is applied instrumentation with real energy-saving relevance and honest estimation methods. Suitable for B.E./B.Tech final-year projects in Electronics, Electrical and IoT & Embedded Systems.
Components & software requirements
- ESP32 development board (Wi-Fi telemetry)
- Pressure transducer (4–20 mA / 0–5 V type)
- Solenoid valve (drain + decay-test isolation)
- Air receiver tank + reference pressure gauge (demo rig)
- Relay module (compressor/valve interface)
- Single-page plant dashboard (HTML/JS)
- Arduino IDE (C/C++ firmware)
Delivery information
Built-to-order project. Delivery timeline is shared after order confirmation based on current queue.
Support terms
Complete documentation, setup guide, and viva preparation included. Support for setup and explanation provided.