
More project photos (2)

The problem
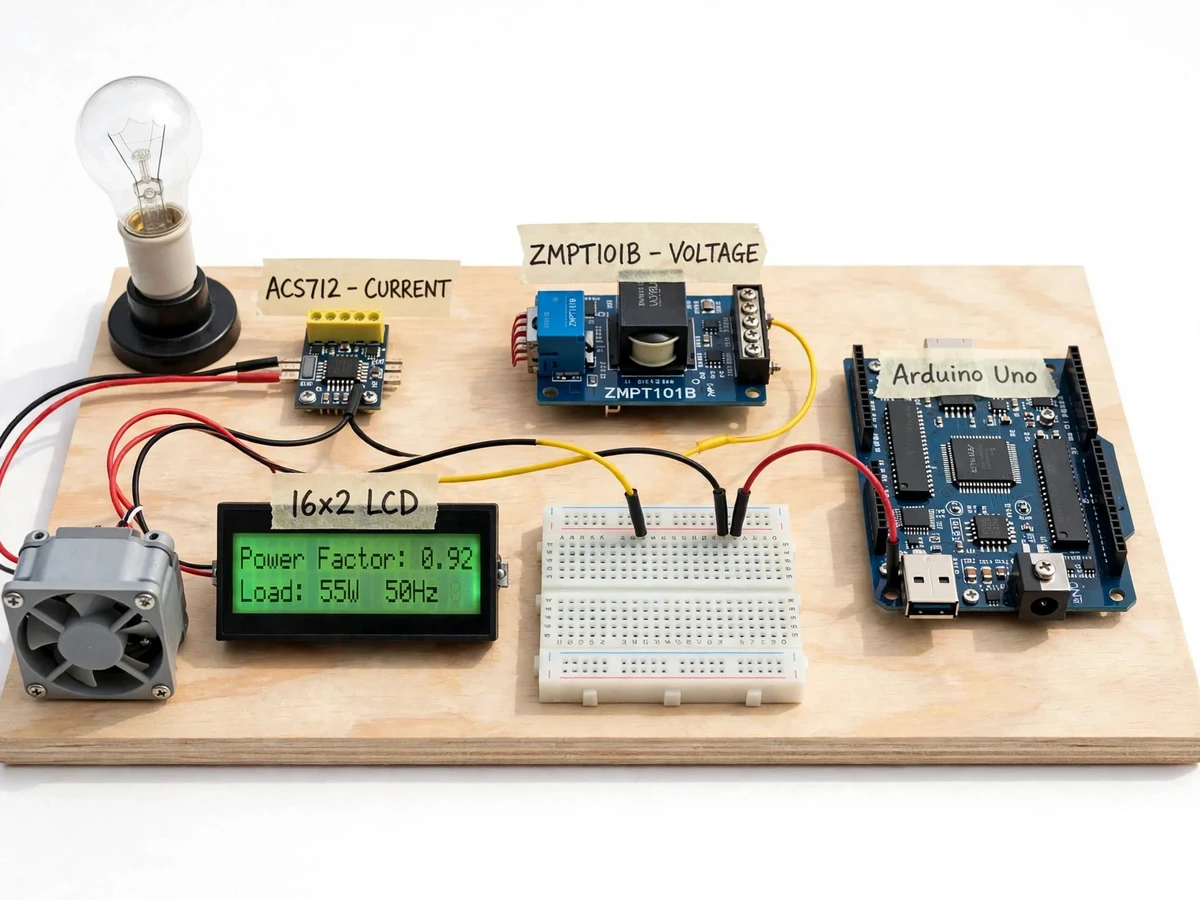
The Single-Phase Power Factor Meter with LCD Display is a bench instrument that makes an invisible electrical quantity visible: the phase difference between voltage and current in a single-phase AC circuit. It connects a test load through a voltage sensor and a current sensor, measures both waveforms with an Arduino Uno, and displays power factor, active power, apparent power and reactive power on a 16 × 2 character LCD. The problem it addresses is simple: a clamp meter shows current, and a multimeter shows voltage, but neither shows how far the current waveform lags or leads the voltage waveform. With inductive loads such as motors and fans, that shift means the supply must carry more current than the useful power alone requires, which is why power factor matters for efficiency and equipment sizing. Without a meter that times the shift directly, the concept stays abstract; this meter turns it into a number that changes as loads change.
How it works
Power factor is the cosine of the angle by which current leads or lags voltage, so this meter measures that angle directly rather than inferring it. The ZMPT101B module scales the mains voltage down to a low-voltage signal, while the ACS712 sensor produces a voltage proportional to the load current through the Hall effect. Both signals feed zero-crossing detection, and the Arduino Uno times the gap between the voltage crossing and the current crossing on each mains cycle. That time gap, divided by the measured mains period and multiplied by 360 degrees, gives the phase angle, and its cosine gives the power factor. The order of the two crossings gives the leading or lagging state. Sampled voltage and current give RMS values, from which the three power quantities follow by standard formulas, and the capacitor hint follows from the measured values toward the design target. The LCD then presents the full set of readings for the connected load.
- The test load is connected in series with the ACS712 current sensor, while the ZMPT101B module is connected across the single-phase supply feeding that load.
- The ZMPT101B scales the mains voltage to a low-voltage waveform, and the ACS712 outputs a voltage proportional to the instantaneous load current.
- Zero-crossing detectors produce a pulse each time the voltage waveform and the current waveform cross zero, and the Arduino Uno records the timing of both pulse trains.
- The firmware measures the time interval between the voltage zero crossing and the following current zero crossing, divides it by the measured mains period, and multiplies by 360 degrees to obtain the phase angle.
- Power factor is calculated as the cosine of that phase angle, and the order of the crossings decides the leading or lagging indication shown on the display.
- RMS voltage and RMS current are computed from the sampled waveforms; active power is their product times power factor, apparent power is their product, and reactive power follows from the standard single-phase relationship between the two.
- The capacitor hint is calculated from the measured active power and power factor toward a 0.95 design-target power factor, and displayed as a capacitance in microfarads with no switching action.
- The LCD refreshes with power factor, leading/lagging state, active power, apparent power, reactive power and the capacitor hint, updating approximately once per second.
Builder note from the build: the zero-cross inputs must share a common ground with the sensor outputs, and the ZMPT101B trim potentiometer is adjusted once against a multimeter reading so the displayed voltage matches before phase timing is trusted. A practical wiring caution applies throughout: mains connections are made only with the supply switched off, and the low-voltage controller side is never probed while the board is connected to mains.
Tech stack:
- Arduino Uno
- ZMPT101B voltage sensor module
- ACS712 Hall-effect current sensor
- 16 × 2 character LCD display
- Zero-crossing detection
- Embedded C · Arduino IDE
- Single-phase AC measurement
- Power factor calculation
| Parameter | Value |
|---|---|
| Controller | Arduino Uno with ATmega328P microcontroller · 5 V DC operating voltage (Datasheet) |
| Supply measured | Single-phase AC · 230 V AC nominal · 50 Hz nominal |
| Voltage sensing | ZMPT101B module · 250 V AC rated input (Datasheet) |
| Current sensing | ACS712-05B · ±5 A range (Datasheet) · 185 mV/A sensitivity (Datasheet) |
| Controller ADC | 10-bit resolution (Datasheet) |
| Display | 16 × 2 character LCD (16 characters per line · 2 lines) |
| Power quantities | Active power in W · apparent power in VA · reactive power in var |
| Power factor range | 0.00 to 1.00 dimensionless · leading or lagging indication |
| Display update | Approximately 1 reading per second (Design target) |
| Capacitor hint | Capacitance in µF toward a 0.95 design-target power factor (Design calculation only) |
Project features
The meter's core capabilities are zero-crossing phase-angle timing, complete power reporting, leading/lagging indication and a design-only capacitor hint, all shown on a live LCD readout. Phase-angle timing is the heart of the build: instead of estimating power factor from current alone, the controller measures the actual time shift between the voltage and current waveforms and converts it into an angle. Around that measurement sit the three power quantities — active, apparent and reactive — so the display tells the full story of what a load draws, not just one number. The leading/lagging indication then says which way the shift runs, which is what decides whether a capacitor or an inductor would be the correcting element in theory. Finally, the capacitor-size hint turns the measured values into a concrete design figure, while staying strictly a calculation: the meter itself switches nothing.
- [Zero-crossing phase-angle timing] The controller detects the instant each waveform crosses zero and measures the time interval between the voltage crossing and the current crossing, converting that interval into a phase angle for every mains cycle measured.
- [Leading/lagging indication] The display states whether the current leads or lags the voltage, so a capacitive load and an inductive load are immediately distinguishable instead of both showing the same bare power factor number.
- [Active, apparent and reactive power] Alongside power factor, the LCD shows active power in watts, apparent power in volt-amperes and reactive power in volt-amperes reactive, giving the complete single-phase power picture for the connected load.
- [Capacitor-size hint (design calculation only)] From the measured active power and power factor, the firmware calculates the capacitance in microfarads that would be needed in theory to reach a 0.95 design-target power factor. The hint is displayed only; the meter connects no capacitor and corrects nothing automatically.
- [Live LCD readout] All readings appear on a 16 × 2 character LCD mounted on the prototype board, updating approximately once per second, so the effect of swapping a test load is visible immediately during a demonstration.
- [Isolated voltage and current sensing] Voltage is sensed through a ZMPT101B transformer module and current through an ACS712 Hall-effect sensor, so the low-voltage controller side stays galvanically separated from the mains conductors being measured.
- [Optional serial data logging] (Optional customization, not part of the base build) Readings can be streamed over the controller's serial port to a computer for recording and plotting, developed on request.
Implemented in the base build: the first six features above. Serial data logging is an optional customization, developed on request and not included in the base build. Automatic capacitor switching is future scope only and is not part of this project.
What is included
- Working prototype on a base board: Arduino Uno, ZMPT101B voltage module, ACS712 current sensor, breadboard wiring and 16 × 2 LCD
- Firmware source code with zero-crossing timing, power calculations and capacitor-hint computation
- Circuit and wiring documentation, including the mains-safety notes for the demonstration setup
- Component list with sensor module details
- Setup and demonstration guidance, including the trim-potentiometer calibration step and suggested test loads
- Project report PDF (background, power-factor theory, methodology, results format)
- PPT presentation for final review
- Viva Q&A preparation document (phase angle, leading/lagging, active vs reactive power, capacitor sizing theory)
Limitations & prerequisites
- Single-phase only: three-phase supplies and three-phase loads are out of scope for this build.
- Current range is limited to ±5 A (Datasheet) by the ACS712-05B sensor; larger loads need a different sensor, offered as an optional customization.
- Readings are indicative bench values: no calibrated accuracy is claimed, and the meter is not billing-grade, panel-certified or permanently installable equipment.
- Zero-cross timing assumes broadly sinusoidal waveforms; heavily distorted waveforms from some dimmers and switch-mode supplies can make readings less stable.
- The capacitor hint is a calculation toward a 0.95 design-target power factor only: it switches nothing, and any real capacitor must be rated for the mains voltage before use.
- Mains-voltage wiring is involved, so the build is demonstrated enclosed and handled with mains safety precautions; it is a bench demonstration unit, not a panel meter.
- The display updates approximately 1 time per second (Design target); the meter is not a waveform recorder or an oscilloscope.
Frequently Asked Questions
Is this project suitable for a final-year project?
Yes, for B.E./B.Tech Electrical Engineering programmes and related electrical diploma courses. It demonstrates single-phase AC theory, sensor interfacing, timing-based measurement and power calculations in one working bench instrument, with a clear demonstration: swap the load and the readings change. The report explains the theory behind each reading, and the demonstration is easy to stage with a lamp and a small motor as contrasting loads.
What is the main technology used?
An Arduino Uno reads a ZMPT101B voltage sensor module and an ACS712 Hall-effect current sensor, times the zero crossings of both waveforms, and computes power factor and the three power quantities for display on a 16 × 2 character LCD. Calibration is a single trim-potentiometer adjustment against a multimeter, and the firmware source is included so the timing and calculation logic can be inspected and explained.
Does this meter correct the power factor automatically?
No. This meter only measures power factor and displays a capacitor-size hint as a design calculation. It connects no capacitor and switches nothing; automatic power factor correction would be a separate build with relay-switched capacitor stages, listed as future scope. The hint tells the builder what capacitance the theory calls for; selecting, rating and fitting any real capacitor is a separate step, not something this meter does.
Which loads can it measure?
Single-phase loads within the ±5 A (Datasheet) range of the ACS712-05B sensor, including resistive loads such as lamps, inductive loads such as small motors and fans, and capacitive loads. A lamp shows a near-unity reading, while a motor shows a lagging reading. Loads above that current range, three-phase loads and heaters beyond the sensor range are out of scope for the base build.
Can this project be customized?
Yes, within feasibility. Realistic options include serial data logging, a higher-range current sensor for larger loads, additional test-load switching, and a three-phase extension. Automatic capacitor switching can also be developed as a separate enhancement, but it is not part of the base build. College-specific documentation formats can also be accommodated, and the report, presentation and viva notes are prepared with the chosen configuration in mind.
Components & software requirements
- Arduino Uno
- ZMPT101B voltage sensor module
- ACS712 Hall-effect current sensor
- 16 × 2 character LCD display
- Zero-crossing detection
- Embedded C · Arduino IDE
- Single-phase AC measurement
- Power factor calculation
Delivery information
Built-to-order project. Delivery timeline is shared after order confirmation based on current queue.
Support terms
Complete documentation, setup guide, and viva preparation included. Support for setup and explanation provided.
Download free synopsis (PDF)
Enter your name and WhatsApp number — the synopsis PDF downloads immediately. We may send occasional project updates on WhatsApp; no spam.