
More project photos (2)
The problem
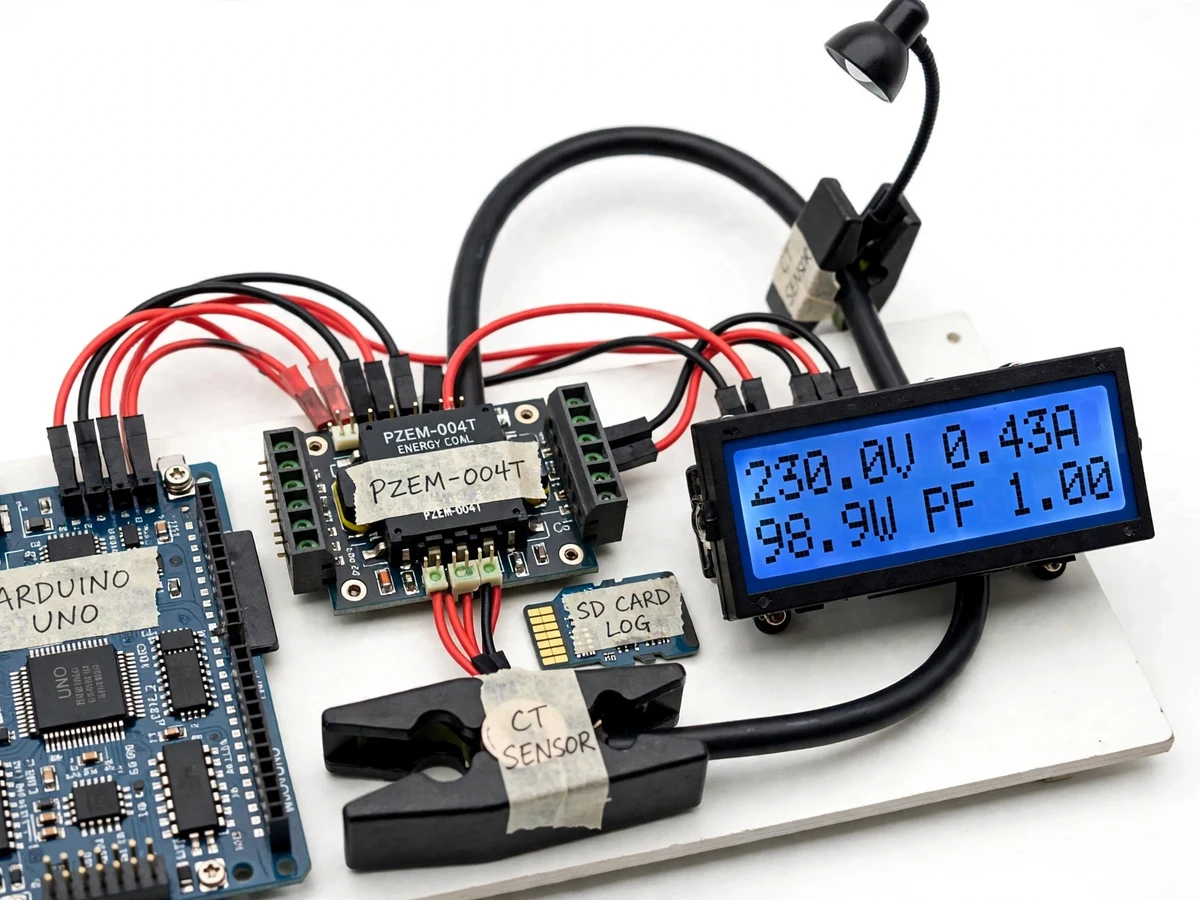
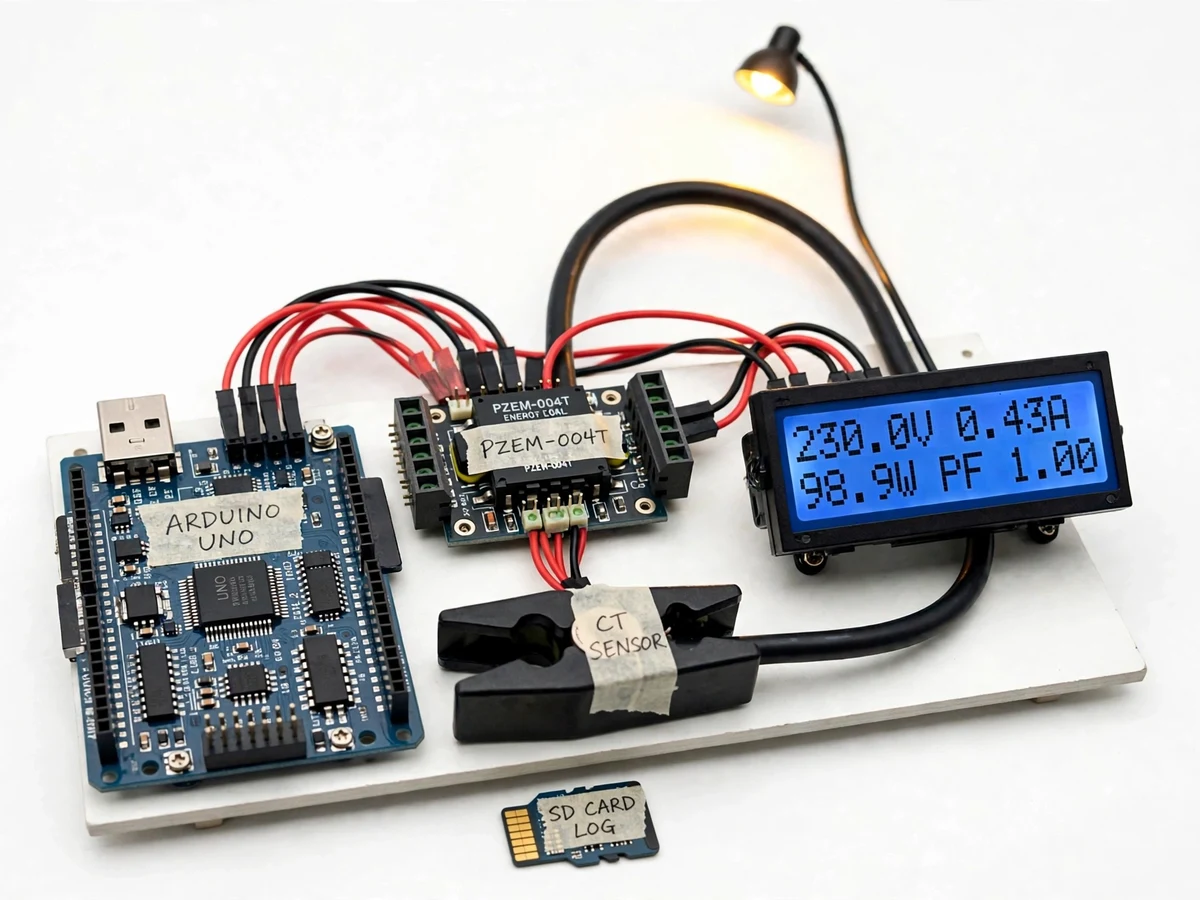
Digital Wattmeter with Power Factor Display and Data Logging is a bench instrument that measures one single-phase AC load at a time and shows its electrical quantities on a display, instead of leaving them hidden inside a plug or a meter cupboard. Many students can state the formula for electrical power yet have never watched voltage, current and power factor change together when a real load is switched on or swapped for a different appliance. This project closes that gap with a PZEM-004T energy meter module, an Arduino controller, a character LCD and an SD card logger arranged as a single bench unit: the load connects through the metered outlet, the display reports the live quantities, and the logger records them for later comparison. A lamp load makes the idea concrete, drawing about 0.43 A at about 230 V with a power factor near 1.00, for about 99 W of real power.
One single-phase AC load connected through the metered outlet.
Follow the working sequence
How it works
Digital Wattmeter with Power Factor Display and Data Logging works by sensing one AC load through a dedicated meter module, polling that module from a microcontroller, and presenting the results two ways at once: on a display for the room, and in a log file for later analysis. The PZEM-004T module measures the load circuit directly, the Arduino asks it for fresh values over a serial link, and the firmware formats those values for the LCD while appending them to the SD card on a fixed interval. Changing the load changes the sensed quantities, so the whole chain from cable to display to log file can be followed during a single demonstration. Because sensing, polling and display are separate stages, a fault can be traced stage by stage: a blank display points at the controller link, while a zero current reading points at the transformer clip.
- The test load connects through the metered outlet, with the mains voltage terminals of the PZEM-004T wired to the supply side under qualified supervision and the mains section enclosed before power is applied.
- The split-core current transformer clips around one conductor of the load cable only. Builder note: passing both the live and neutral conductors through the transformer cancels the sensed field and the current reading falls to near zero, so a zero current reading with a running load is the first clue that the transformer is clipped around the wrong bundle.
- The PZEM-004T samples the voltage and current waveforms and derives active power, accumulated energy, frequency and power factor for the single-phase load.
- The Arduino polls the module over TTL serial using the Modbus-RTU protocol at 9600 baud and receives all six quantities in one reading cycle.
- The firmware writes the four live values to the character LCD: voltage and current on the first line, active power and power factor on the second; accumulated energy and frequency are written to the SD log row with every reading.
- At a regular interval of approximately 5 seconds, the firmware appends one CSV row with the six quantities and the elapsed run time to the microSD card.
- Swapping the test load updates the display within the next reading cycle, while the accumulated energy total keeps counting until the reset pushbutton is pressed.
Tech stack:
- Arduino Uno
- PZEM-004T-100A module with split-core current transformer
- Character LCD (live quantities display)
- MicroSD card logging module
- Arduino IDE with C++ firmware
- Modbus-RTU over TTL serial at 9600 baud
| Parameter | Value |
|---|---|
| AC voltage range | 80–260 V AC (datasheet value) |
| AC current range | 0–100 A via split-core CT (datasheet value) |
| Active power range | 0–23 kW (datasheet value) |
| Active energy range | 0–9999.99 kWh (datasheet value) |
| Frequency range | 45–65 Hz (datasheet value) |
| Power factor range | 0.00–1.00 (datasheet value) |
| Display | Character LCD showing voltage · current · power · power factor (design choice) |
| Logging interval | Approximately 5 seconds between records (design target) |
| Communication | TTL serial · Modbus-RTU at 9600 baud (datasheet value) |
| Controller supply | 5 V DC via USB adapter (design target) |
Project features
Digital Wattmeter with Power Factor Display and Data Logging is built around live measurement, clear display and recorded evidence, so a demonstration never depends on a single fleeting reading. The module reports six quantities for one load: the LCD shows the four live ones, power factor is explained in numbers rather than slogans, and the SD log stores all six as a time series that can be plotted and discussed after the demonstration ends. The three capabilities that carry the project are the live-quantity LCD readout, the power factor display with its voltage-times-current-times-power-factor meaning, and the SD card log that turns a bench test into analysable data. For the report, the log matters as much as the display: a plotted session shows a load change as a step in the data. Nothing in the base build needs an internet connection or a cloud account, so the demonstration runs entirely on the bench.
- [Live display] Voltage, current, active power and power factor appear on the character LCD, so the four live quantities can be read together without switching screens; accumulated energy and frequency are recorded in every SD log row.
- [Power factor readout] Power factor is displayed as its own number from 0.00 to 1.00, making visible the difference between apparent power and the real power that actually does work in the load.
- [SD card data logging] Readings are appended as rows to a CSV file on a microSD card at a regular interval, so a load test can be replayed, plotted and compared instead of being remembered from the display.
- [Non-invasive current sensing] A split-core current transformer clips around one conductor of the load cable, so current is sensed without cutting the cable or inserting a shunt into the load circuit.
- [Accumulated energy total] The meter keeps a running energy total in kilowatt-hours, so the cost of running a load over a session can be worked out from the logged energy and a tariff figure.
- [Energy reset control] A pushbutton command resets the accumulated energy total through the module, so each new load test can start from zero without restarting the whole unit.
- [Load-comparison demonstration] Swapping the test load changes the display immediately: a resistive lamp shows a power factor near 1.00, while a motor load such as a small fan shows a lower power factor at a comparable current, which gives the demonstration a point to discuss.
What is included
- Working bench wattmeter prototype with metered outlet
- Arduino firmware source code with serial polling and SD logging
- Circuit and wiring diagram with the mains section marked
- Component list with module and transformer details
- Setup and mains-safety instructions
- SD log file format note with a sample CSV layout
- Project abstract PDF
- Demonstration guidance using lamp and fan loads
Limitations & prerequisites
- Single-phase AC only: the meter does not measure three-phase supplies, DC loads, harmonics or total harmonic distortion, because the PZEM-004T module reports none of those quantities.
- Mains work is hazardous: assembly, wiring and testing must be done under qualified supervision, with the mains section enclosed and the unit never opened while powered.
- Accuracy figures are the module datasheet values (0.5% for voltage, current, power and energy; 1% for power factor) and are not verified by independent calibration in this build.
- Currents below the 0.02 A starting current in the datasheet are not measured, so very small standby loads may read as zero current.
- Log rows carry elapsed run time rather than wall-clock timestamps, because the base build has no real-time clock module.
- The unit is a bench learning instrument, not a certified billing meter, and its readings must not be used for revenue metering or safety-critical decisions.
Frequently Asked Questions
Which module measures the power, and what does it report?
The PZEM-004T-100A module measures the load through its voltage terminals and a split-core current transformer, and it reports six quantities for a single-phase AC load: voltage, current, active power, accumulated energy, frequency and power factor. The Arduino polls those values over TTL serial, shows the four live quantities on the LCD, and logs all six to the SD card. No extra sensing hardware is needed for the six displayed quantities.
Is this project suitable for a final-year project?
Yes, for Electrical Engineering final-year work, because it combines AC measurement theory, current-transformer sensing, serial communication and data logging in one demonstrable instrument. It gives a clear demonstration (swap a load, watch power factor change) plus logged data for the report, and the limitations around mains safety and datasheet accuracy are honest discussion points.
Is the mains wiring safe to build?
The build is safe only when it is assembled and tested under qualified supervision, with the mains section enclosed in an insulated housing and the unit never opened while connected to mains power. Low-voltage work on the Arduino, LCD and SD module can be done separately on the bench, and the mains wiring step is kept distinct from the electronics work. This separation is part of the build instructions.
Can it measure a whole house or a three-phase supply?
No, the meter measures one single-phase AC load at a time through one current transformer, so it cannot monitor a whole house, a distribution board or a three-phase machine. A whole-home meter would need different sensing, isolation and certification, and a three-phase version would need three sensing channels. The bench scope is deliberate: one load, fully explained.
Does it measure harmonics or power quality?
No, the PZEM-004T reports only voltage, current, active power, energy, frequency and power factor, and it provides no harmonic spectrum, distortion figure or waveform capture. Any page or demonstration claiming harmonic analysis from this module would be inventing a capability the hardware does not have. Power-quality analysis is listed as future scope with different hardware.
What can the logged data be used for?
The logged CSV rows let a student plot voltage, current, power and power factor over a test session, compare two loads side by side, and work out session energy and an indicative running cost from the logged kilowatt-hours and a tariff figure. Because every row is stored, the analysis can be repeated after the demonstration and the report can quote the logged session.
Components & software requirements
- Arduino Uno
- PZEM-004T-100A module with split-core current transformer
- Character LCD (live quantities display)
- MicroSD card logging module
- Arduino IDE with C++ firmware
- Modbus-RTU over TTL serial at 9600 baud
Delivery information
Built-to-order project. Delivery timeline is shared after order confirmation based on current queue.
Support terms
Complete documentation, setup guide, and viva preparation included. Support for setup and explanation provided.
Download free synopsis (PDF)
Enter your name and WhatsApp number — the synopsis PDF downloads immediately. We may send occasional project updates on WhatsApp; no spam.