
More project photos (3)
The problem
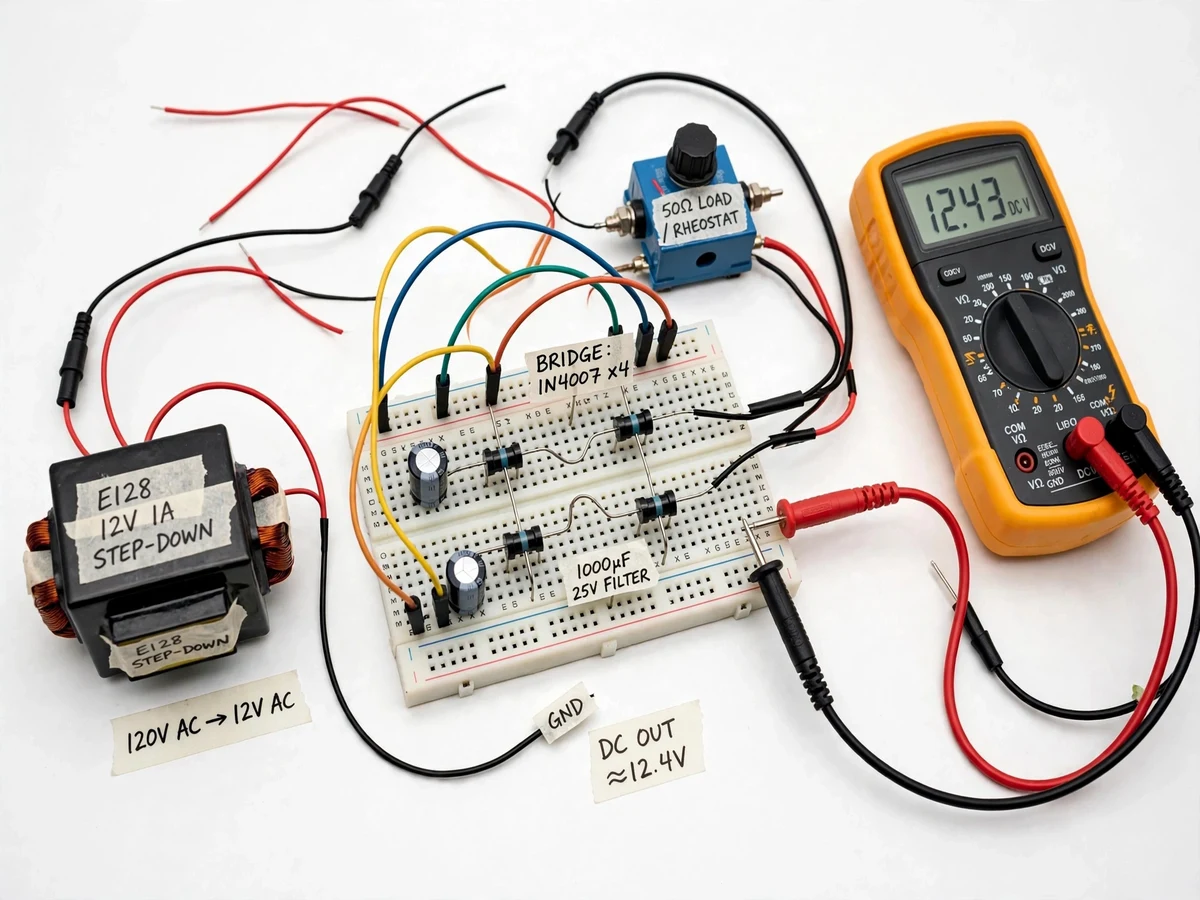
Every regulated DC supply begins the same way: a transformer, a diode bridge, and a filter capacitor. Students can draw the full-wave rectifier's waveforms from memory, but few have watched the ripple shrink as they add capacitance or grow as they load the output down — the bench behaviour that makes the theory stick. This project is that bench: a 12 V step-down transformer feeding a 1N4007 bridge on a breadboard, a 1000 µF filter capacitor, and a rheostat load, with a digital multimeter measuring DC output and AC ripple at each setting. By stepping the load and swapping filter values, students record the ripple-voltage-vs-load-current characteristic, compute the ripple factor, and compare measured values against the textbook expressions — a complete power-electronics experiment built from a handful of parts.
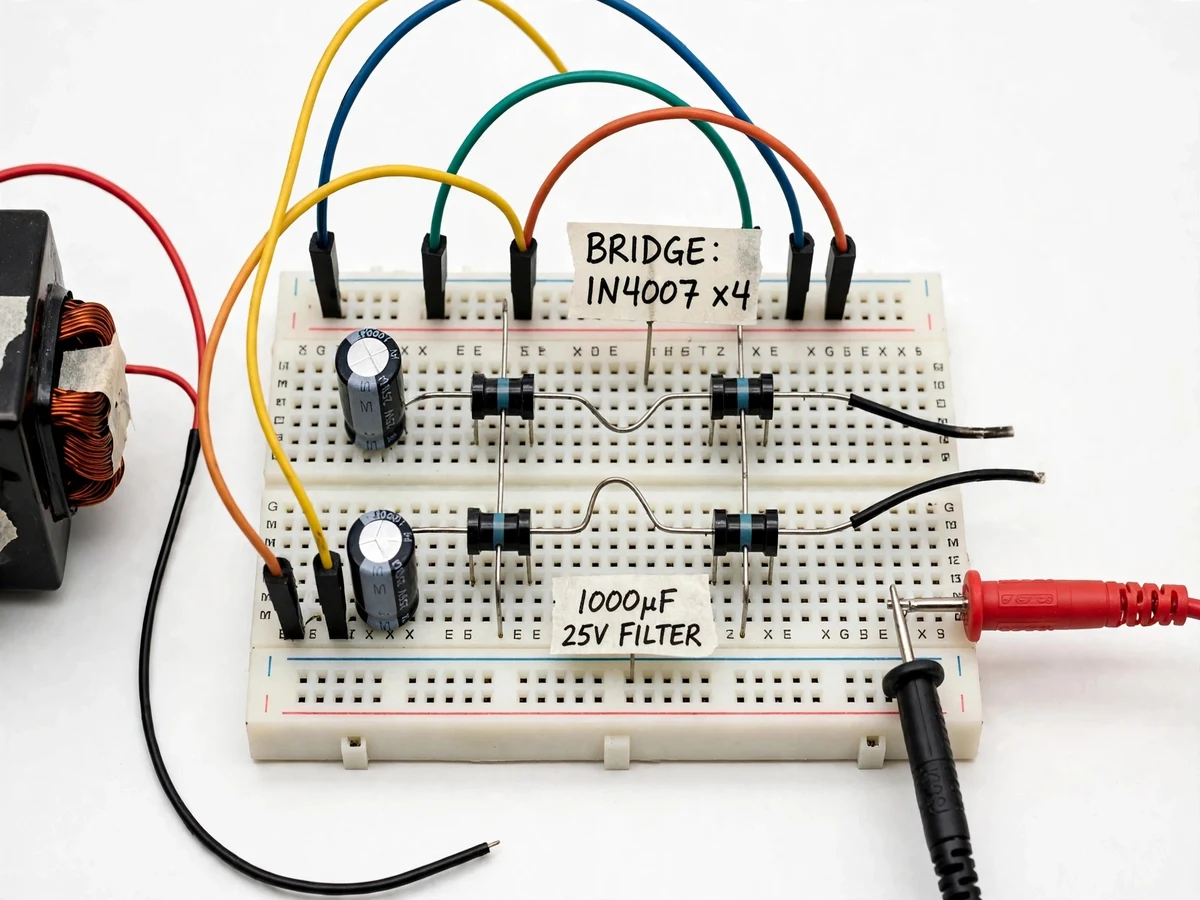
Mains-isolated transformer feeding low-voltage AC to the bridge.
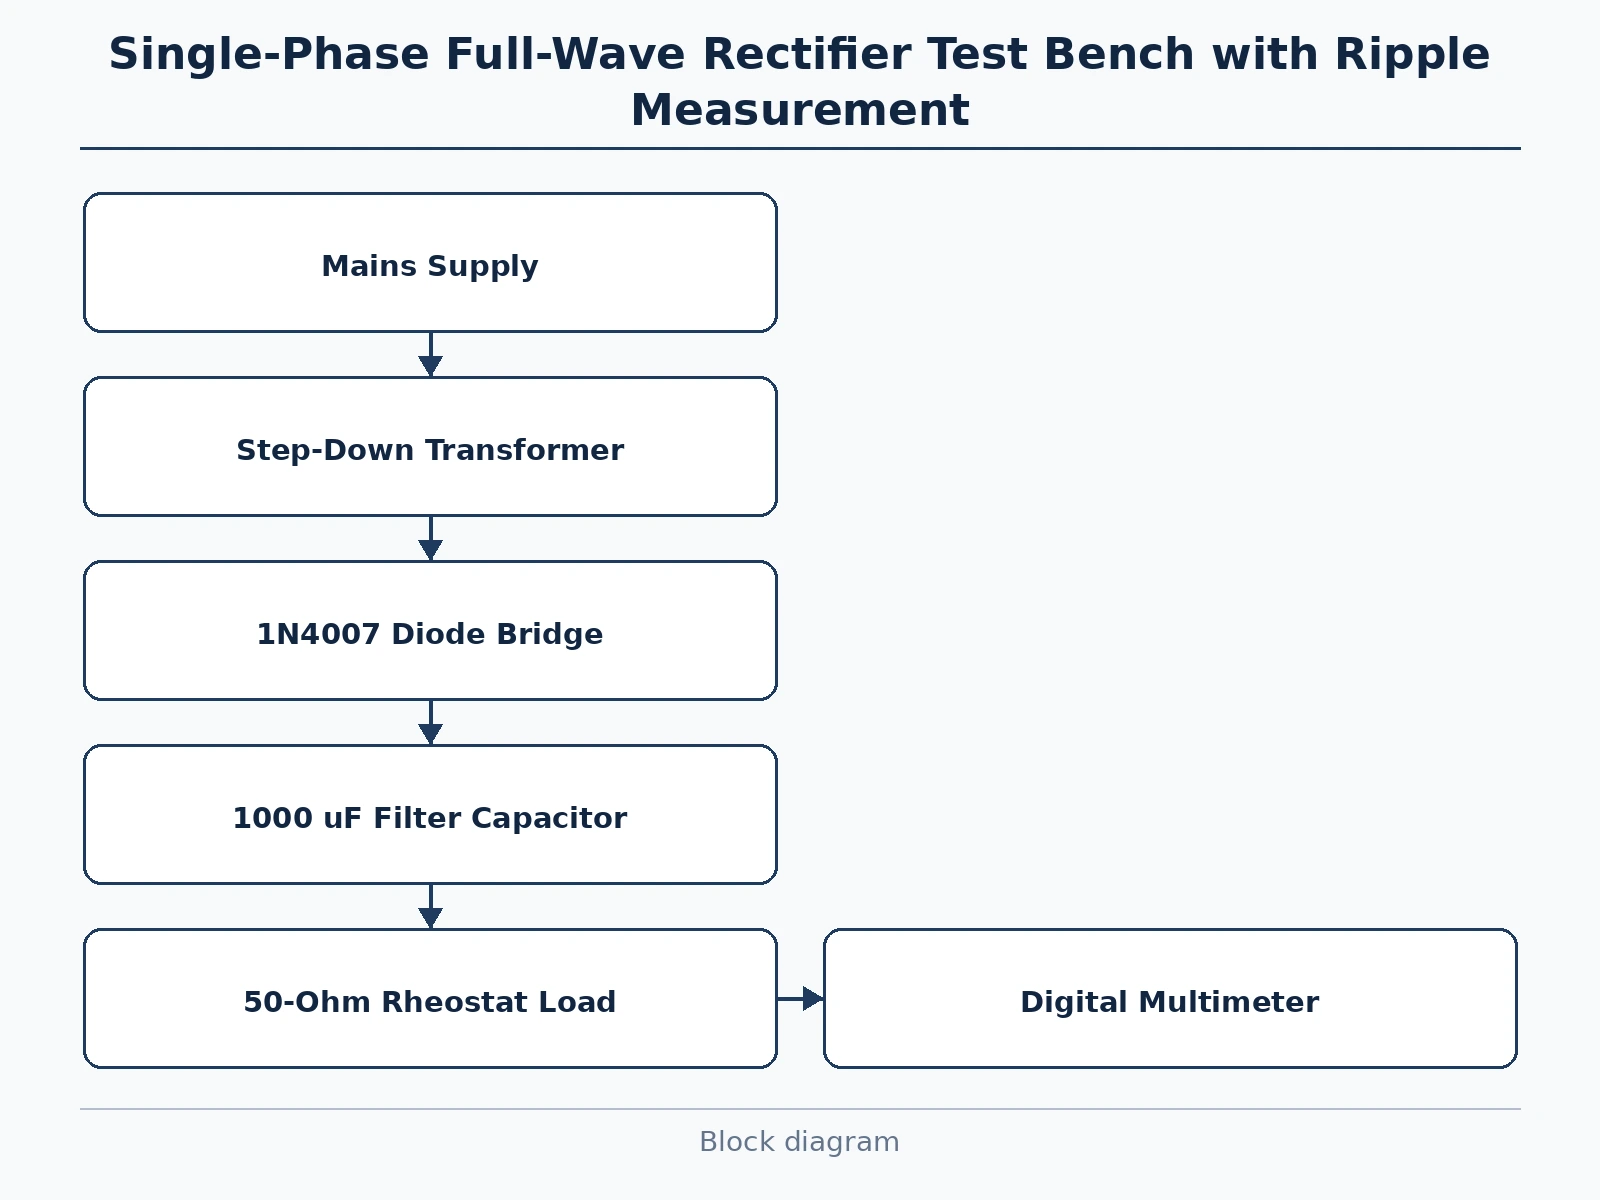
Follow the working sequence
How it works
- The step-down transformer secondary feeds low-voltage AC to the diode bridge; alternate diode pairs conduct on each half-cycle, giving full-wave pulsating DC at the bridge output.
- The filter capacitor charges to the peak of each pulse and supplies the load between pulses, smoothing the output; the multimeter on DC range reads the average output voltage.
- Switching the multimeter to AC millivolts across the same output reads the ripple component riding on the DC level.
- The rheostat is stepped through several load currents; at each step the DC voltage and ripple voltage are recorded in the observation table.
- Readings show the ripple rising and the DC level sagging as load current increases — the load-regulation and ripple characteristics of the unregulated supply.
- The filter capacitor is swapped for a smaller value and the run repeated, showing ripple growing as capacitance falls, exactly as the theory predicts.
Tech stack:
- Step-down transformer (mains-isolated)
- 4 × 1N4007 diodes (bridge)
- 1000 µF electrolytic filter capacitor
- 50-ohm rheostat load
- Digital multimeter (DC + AC mV)
- Breadboard with labelled test points
- Experiment manual with tables
- Connecting leads and probes
| Parameter | Value |
|---|---|
| Input | Step-down transformer, low-voltage AC secondary (design) |
| Rectifier | Full-wave bridge, 4 × 1N4007 (datasheet) |
| Filter | 1000 µF electrolytic, spare values included (design) |
| Load | 50-ohm rheostat, variable (design) |
| Output | Pulsating DC smoothed to approximately 12 V DC (design target) |
| Measurement | Digital multimeter, DC volts + AC millivolt ripple (buyer-run procedure) |
| Ripple factor | Computed from readings vs theory (buyer-run calculation) |
| Safety | Mains-isolated low-voltage secondary only |
Project features
- [Bridge rectifier on breadboard] Four 1N4007 diodes wired as a full-wave bridge, with labelled test points at the AC input and DC output for easy probing.
- [Step-down transformer stage] A mains-isolated step-down transformer supplies safe low-voltage AC to the rectifier, the same front end as a real DC supply.
- [Capacitor filter] A 1000 µF electrolytic filter capacitor smooths the pulsating DC, with spare values supplied for the capacitance-vs-ripple experiment.
- [Variable rheostat load] A 50-ohm rheostat sets the load current from light to heavy, showing directly how ripple grows with load.
- [Multimeter measurement method] DC output and AC ripple are read on a standard digital multimeter — no oscilloscope needed — using the manual's AC-millivolt technique.
- [Ripple factor calculation] The manual walks through computing ripple factor from the readings and comparing with the theoretical value for a full-wave rectifier.
- [Load regulation curve] Students plot output voltage against load current, producing the regulation characteristic every power-supply datasheet shows.
What is included
- Assembled rectifier test bench (transformer, breadboard circuit, rheostat, multimeter leads)
- Component kit with spare filter capacitors and diodes
- Experiment manual with observation tables and ripple-calculation procedure
- Waveform sketch sheets for the report
- Project report PDF (rectifier theory, methodology, sample calculations)
- PPT presentation for final review
- Viva Q&A preparation document (bridge operation, PIV, ripple factor, filter design, regulation)
Limitations & prerequisites
- This is an unregulated supply bench: the output sags with load by design, which is precisely the behaviour under study — a regulated supply is a different project.
- Ripple is measured with the multimeter AC-millivolt method described in the manual; an oscilloscope would show the waveform directly and is listed as an optional extension.
- The bench runs at safe low voltage; mains-side measurements are not part of the experiment and the transformer secondary is the only energized test point.
- Diode heating at sustained heavy load is a classroom-scale effect; the manual sets a maximum continuous load current.
Frequently Asked Questions
Why a bridge rectifier instead of a half-wave one?
The bridge uses both half-cycles, doubling the ripple frequency and halving the ripple for the same filter capacitor. The manual includes a half-wave comparison run so students measure the difference themselves.
How do you measure ripple without an oscilloscope?
Set the multimeter to AC millivolts across the DC output: the meter blocks the DC component and reads the AC ripple riding on it. The manual validates this technique and explains its limits.
What is the ripple factor?
The ratio of the AC ripple component to the DC output level. Students compute it from their readings and compare against the textbook value for a full-wave rectifier, closing the theory-measurement loop.
Why does the output voltage sag when the load increases?
Heavier load current discharges the filter capacitor further between charging pulses, so the average output falls and ripple rises. The load-regulation curve the students plot shows exactly this.
What does the transformer do in this circuit?
It steps the mains down to a safe low voltage and provides isolation. The experiment runs entirely on the low-voltage secondary; the transformer is the same front end a real DC supply uses.
Is this project suitable for a final-year project?
Yes — for Electrical and Electronics engineering programs. It is the foundational power-electronics experiment with genuine measured characteristics, calculations verified against theory, and evergreen viva questions. Suitable for B.E./B.Tech final-year projects in Electrical and Electronics engineering.
Components & software requirements
- Step-down transformer (mains-isolated)
- 4 × 1N4007 diodes (bridge)
- 1000 µF electrolytic filter capacitor
- 50-ohm rheostat load
- Digital multimeter (DC + AC mV)
- Breadboard with labelled test points
- Experiment manual with tables
- Connecting leads and probes
Delivery information
Built-to-order project. Delivery timeline is shared after order confirmation based on current queue.
Support terms
Complete documentation, setup guide, and viva preparation included. Support for setup and explanation provided.
Download free synopsis (PDF)
Enter your name and WhatsApp number — the synopsis PDF downloads immediately. We may send occasional project updates on WhatsApp; no spam.