
More project photos (2)
The problem
Rainfall decides sowing dates, reservoir releases and flood preparedness across India, yet the long historical record behind those decisions is rarely turned into a prediction a student can interrogate. Climatological averages hide year-to-year swings, and simple trend lines miss how individual months combine into a season. This project builds a regression pipeline on the India Meteorological Department (IMD) subdivision record: monthly rainfall values are cleaned, converted into seasonal and lag features, and used to train an XGBoost regressor that predicts a subdivision's June-to-September monsoon total and its annual total in millimetres. Every modelling choice is documented, evaluation uses a chronological hold-out so future years never leak into training, and a dashboard makes the trained model usable — a subdivision is selected, monthly values are entered, and the prediction appears with feature-importance and historical-trend charts.
How it works
- The Rainfall in India CSV is loaded: one row per subdivision-year with 12 monthly rainfall columns in millimetres, four seasonal totals and the annual total.
- Missing values and subdivision name inconsistencies are cleaned, and every subdivision's series is checked for gaps across 1901–2015.
- Features are engineered: seasonal totals (Jan–Feb, Mar–May, Jun–Sep, Oct–Dec), previous-year annual and monsoon rainfall, and 3-year and 5-year rolling means.
- The data is split chronologically — earlier years for training, the final years as a held-out test set — so no future information leaks into the model.
- A linear regression baseline is fitted first; then the XGBoost regressor is trained with documented hyperparameters (tree depth, learning rate, number of estimators, subsampling).
- The test set is evaluated with RMSE and MAE in millimetres and R-squared, reported per target (JJAS and annual) in the project report.
- The trained model is exported, and the dashboard loads it to serve predictions with feature-importance and historical-trend charts.
Tech stack:
- Python 3, pandas, NumPy
- XGBoost (gradient-boosted regressor)
- scikit-learn (splits, baseline, metrics)
- Jupyter Notebook (training and evaluation)
- Matplotlib (report charts)
- HTML, CSS, JavaScript dashboard with canvas charts
- IMD Rainfall in India dataset (via Kaggle)
Dataset & model details
- Dataset: Rainfall in India (Kaggle, uploaded by Rajanand Ilangovan; source data from the India Meteorological Department / Open Government Data platform) — subdivision-wise monthly rainfall in millimetres for 36 meteorological subdivisions, 1901–2015 (115 years, 4,140 subdivision-year rows in the main CSV
rainfall in india 1901-2015.csv). Columns: SUBDIVISION, YEAR, JAN–DEC monthly rainfall, ANNUAL total, and seasonal totals Jan–Feb, Mar–May, Jun–Sep and Oct–Dec. A second file in the dataset gives district-wise rainfall normals for 1951–2000 and is not used for training. Note: some secondary sources describe a 1901–2017 span; the Kaggle file itself ends at 2015, and this project uses the Kaggle file as distributed. - Task: Regression. Input = a subdivision's monthly and seasonal rainfall features, previous-year values and rolling means; output = predicted JJAS (Jun–Sep) monsoon rainfall and annual rainfall, both in millimetres. This is not a classification task and there are no class labels.
- Model: XGBoost regressor (gradient-boosted decision trees, squared-error objective). Separate models are trained for the JJAS target and the annual target. A linear regression model on the same features and split serves as the baseline.
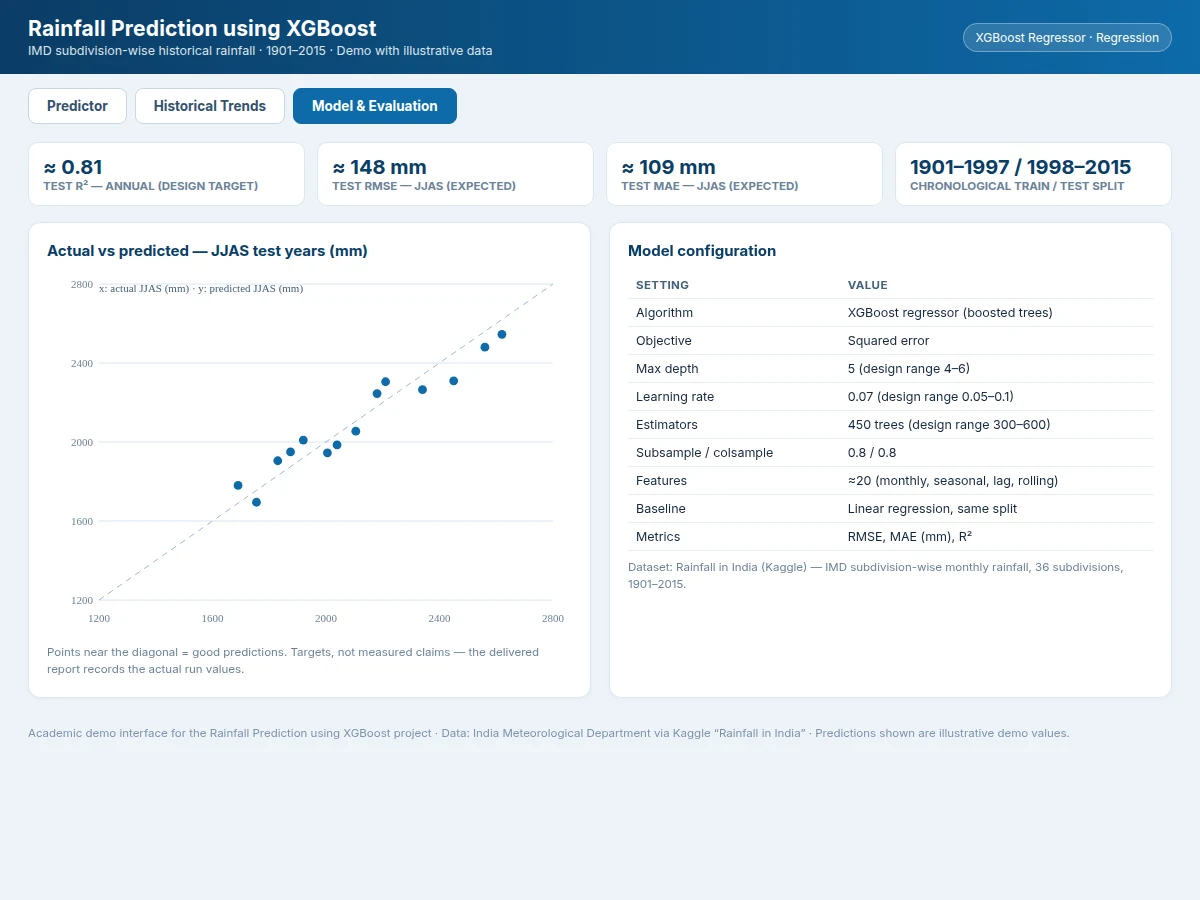
- Metrics: RMSE and MAE in millimetres and R-squared (R²), computed on a chronological held-out test period. No measured performance is claimed in advance: design targets are R² of approximately 0.75–0.85 (expected) for annual rainfall and RMSE of approximately 120–180 mm (expected, subdivision-dependent) for the JJAS target. The delivered report records the actual values from the training run.
| Parameter | Value |
|---|---|
| Dataset coverage | 36 subdivisions, 1901–2015 (4,140 rows) |
| Input features | 12 monthly + 4 seasonal + lag and rolling features (approximately 20) |
| Prediction targets | JJAS monsoon total and annual total, in mm |
| Model | XGBoost regressor (design: max depth 4–6, learning rate 0.05–0.1) |
| Estimators | Approximately 300–600 trees (design target) |
| Train / test split | Chronological, approximately 85% train / 15% test |
| Evaluation metrics | RMSE (mm), MAE (mm), R² |
| Expected test R² (annual) | Approximately 0.75–0.85 (design target, not measured) |
| Inference time | Under 1 second per prediction on a laptop CPU (expected) |
| Dashboard | Single-file web app, runs offline after download |
Project features
- [Subdivision rainfall predictor] Select any of the 36 IMD meteorological subdivisions and monthly rainfall inputs; the dashboard returns the predicted JJAS monsoon total and annual total in millimetres.
- [XGBoost regression model] A gradient-boosted tree regressor trained on engineered monthly, seasonal, lag and rolling-mean features, with hyperparameters recorded in the notebook.
- [Chronological evaluation] Training uses earlier years and testing uses the most recent years, so reported RMSE, MAE and R-squared reflect genuine out-of-sample behaviour.
- [Feature-importance view] Ranked feature contributions show which months and seasonal aggregates drive each prediction, giving a concrete explanation to discuss in the viva.
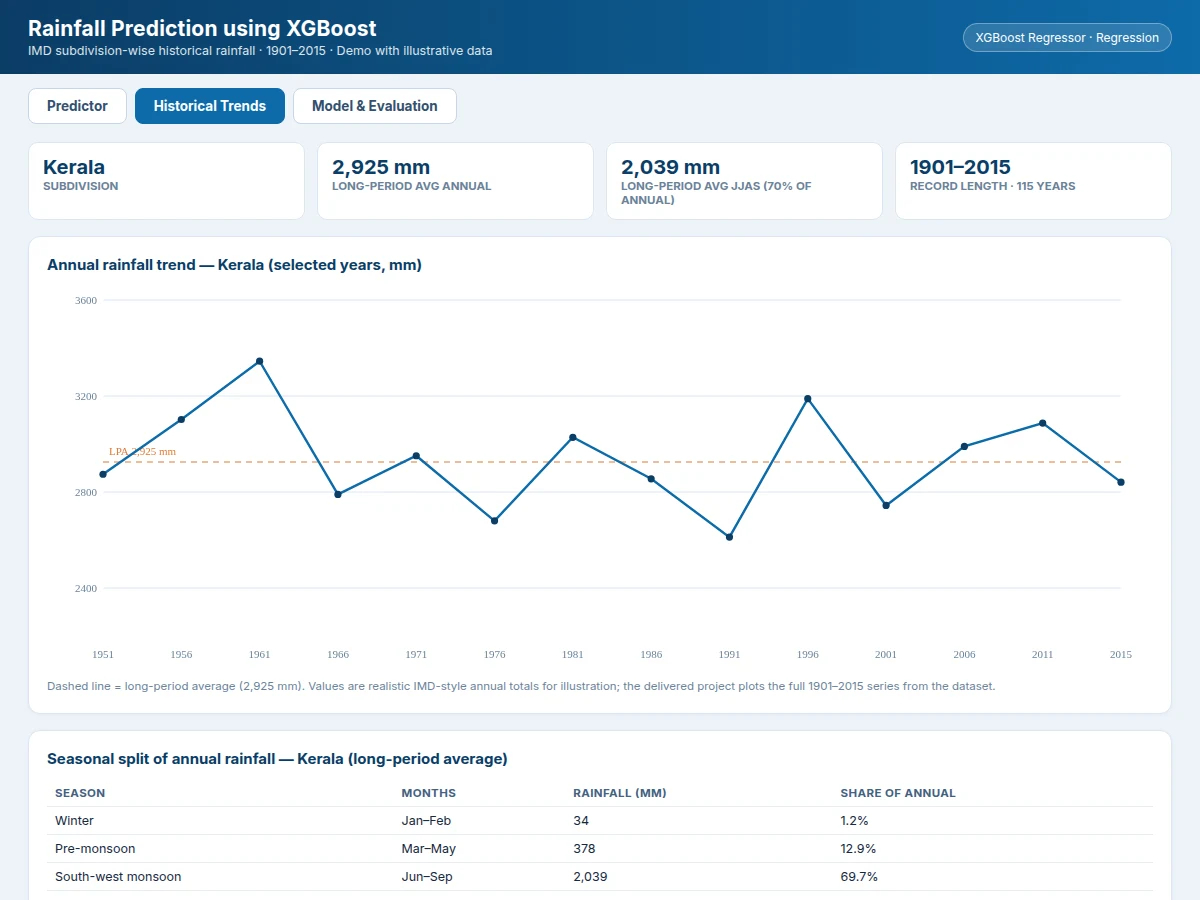
- [Historical trend explorer] Interactive charts of a subdivision's annual and monsoon rainfall across the record, with long-period average and variability statistics.
- [Baseline comparison] A linear regression baseline is trained on the same split, so the benefit of boosting is quantified instead of assumed.
- [Reproducible notebook] Data loading, cleaning, feature engineering, training, evaluation and model export in one documented Jupyter notebook that reruns end to end.
- [Optional: ENSO and SST features] Adding El Niño–Southern Oscillation or sea-surface-temperature indices is available as an optional customization; it is not part of the base build.
What is included
- Complete training and evaluation Jupyter notebook
- Trained XGBoost model files with preprocessing and feature code
- Prediction dashboard (subdivision selector, monthly inputs, prediction, importance and trend charts)
- Evaluation outputs: RMSE, MAE, R² tables and actual-vs-predicted charts
- Project report PDF (background, dataset study, methodology, results, limitations)
- PPT presentation for final review
- Viva Q&A preparation document (regression, gradient boosting, leakage, feature importance)
Limitations & prerequisites
- The Kaggle dataset ends in 2015, so the model learns pre-2016 climate behaviour; recent climate shifts are not represented in training.
- Predictions are subdivision averages — the model cannot resolve district, city or farm-level rainfall.
- The base build uses rainfall history only; ENSO, Indian Ocean Dipole and sea-surface-temperature signals are excluded, which caps achievable accuracy.
- Rainfall is partly driven by chaotic monsoon dynamics, so a meaningful irreducible error remains even for a well-tuned model.
- Extreme outlier years (exceptional droughts or deluges) are under-represented in 115 years of data and are predicted least reliably.
- The dashboard demonstrates the trained model on historical-style inputs; it is not connected to any live IMD feed or operational forecast service.
- This is an academic prototype for learning regression modelling, not an operational weather forecast for farming or disaster decisions.
Frequently Asked Questions
Which dataset is used in this project?
The project uses the Rainfall in India dataset distributed on Kaggle, which republishes India Meteorological Department records. It holds subdivision-wise monthly rainfall in millimetres for 36 meteorological subdivisions from 1901 to 2015, with seasonal totals for winter, pre-monsoon, monsoon and post-monsoon periods plus an annual total column for every subdivision-year row.
Is this project suitable for a final-year project?
Yes. It is suitable for B.E. and B.Tech final-year projects in Computer Science, IT and AI and Machine Learning because it covers a complete regression pipeline: data cleaning, exploratory analysis, feature engineering, gradient-boosted model training, honest evaluation with RMSE, MAE and R-squared, and a working prediction dashboard that can be demonstrated live during review.
Why is XGBoost used instead of linear regression?
Rainfall responds to monthly patterns in a non-linear way, and a wet June does not simply add a fixed amount to the annual total. XGBoost builds boosted decision trees that capture interactions between months and seasons without manual formula design. The notebook still trains a linear regression baseline first, so the improvement from boosting is measured rather than assumed.
What accuracy does the model achieve?
No fixed accuracy is promised, because rainfall is inherently variable and results depend on the subdivision and the train-test split. The project reports RMSE and MAE in millimetres and R-squared on a held-out chronological test period. Design targets are an R-squared of approximately 0.75 to 0.85 for annual rainfall, and the report records the actual measured values.
Can the model predict rainfall for my district or city?
Not directly in the base build. The dataset is recorded at meteorological subdivision level, so predictions describe a subdivision average, not a single district, city or farm. A district-level extension would need district-wise IMD data or gridded rainfall data and retraining, and it is listed as optional customization rather than part of the delivered base project.
Can this project be customized?
Yes, within realistic limits. The target can be switched between annual and JJAS monsoon rainfall, extra subdivisions can be analysed, lag and rolling-mean features can be added, and the dashboard can be restyled. Adding live weather feeds, ENSO or sea-surface-temperature features, or district-level data is possible as a separate extension because it changes the data pipeline.
Components & software requirements
- Python 3, pandas, NumPy
- XGBoost (gradient-boosted regressor)
- scikit-learn (splits, baseline, metrics)
- Jupyter Notebook (training and evaluation)
- Matplotlib (report charts)
- HTML, CSS, JavaScript dashboard with canvas charts
- IMD Rainfall in India dataset (via Kaggle)
Dataset & model details
- Dataset: Rainfall in India (Kaggle, uploaded by Rajanand Ilangovan; source data from the India Meteorological Department / Open Government Data platform) — subdivision-wise monthly rainfall in millimetres for 36 meteorological subdivisions, 1901–2015 (115 years, 4,140 subdivision-year rows in the main CSV
rainfall in india 1901-2015.csv). Columns: SUBDIVISION, YEAR, JAN–DEC monthly rainfall, ANNUAL total, and seasonal totals Jan–Feb, Mar–May, Jun–Sep and Oct–Dec. A second file in the dataset gives district-wise rainfall normals for 1951–2000 and is not used for training. Note: some secondary sources describe a 1901–2017 span; the Kaggle file itself ends at 2015, and this project uses the Kaggle file as distributed. - Task: Regression. Input = a subdivision's monthly and seasonal rainfall features, previous-year values and rolling means; output = predicted JJAS (Jun–Sep) monsoon rainfall and annual rainfall, both in millimetres. This is not a classification task and there are no class labels.
- Model: XGBoost regressor (gradient-boosted decision trees, squared-error objective). Separate models are trained for the JJAS target and the annual target. A linear regression model on the same features and split serves as the baseline.
- Metrics: RMSE and MAE in millimetres and R-squared (R²), computed on a chronological held-out test period. No measured performance is claimed in advance: design targets are R² of approximately 0.75–0.85 (expected) for annual rainfall and RMSE of approximately 120–180 mm (expected, subdivision-dependent) for the JJAS target. The delivered report records the actual values from the training run.
Delivery information
Built-to-order project. Delivery timeline is shared after order confirmation based on current queue.
Support terms
Complete documentation, setup guide, and viva preparation included. Support for setup and explanation provided.
Download free synopsis (PDF)
Enter your name and email — the synopsis PDF downloads immediately. We may send occasional project updates; no spam, unsubscribe anytime.