
More project photos (2)
The problem
Farmers and traders lose money when they sell at the wrong time: onion prices can double in a fortnight or crash by half after a bumper arrival, yet most mandi decisions are still made on word-of-mouth and last week's rate. Meanwhile the government publishes daily min, max and modal prices for hundreds of mandis on Agmarknet and eNAM — a rich public time series that most student projects ignore. This project turns that raw mandi data into a genuine forecasting system: weekly modal-price series are cleaned and feature-engineered (lags, rolling means, arrival volumes, seasonality), an XGBoost regressor is trained with walk-forward validation, and the result is served through an interactive dashboard where the student picks a commodity and mandi and sees the historical curve plus an 8-week forecast with an uncertainty band. The built-to-order training run is executed on the buyer's chosen commodity–mandi pair, and the report documents the real measured error from the walk-forward folds — no invented accuracy anywhere.
Selects commodity, mandi and forecast horizon on the dashboard.
Follow the working sequence
How it works
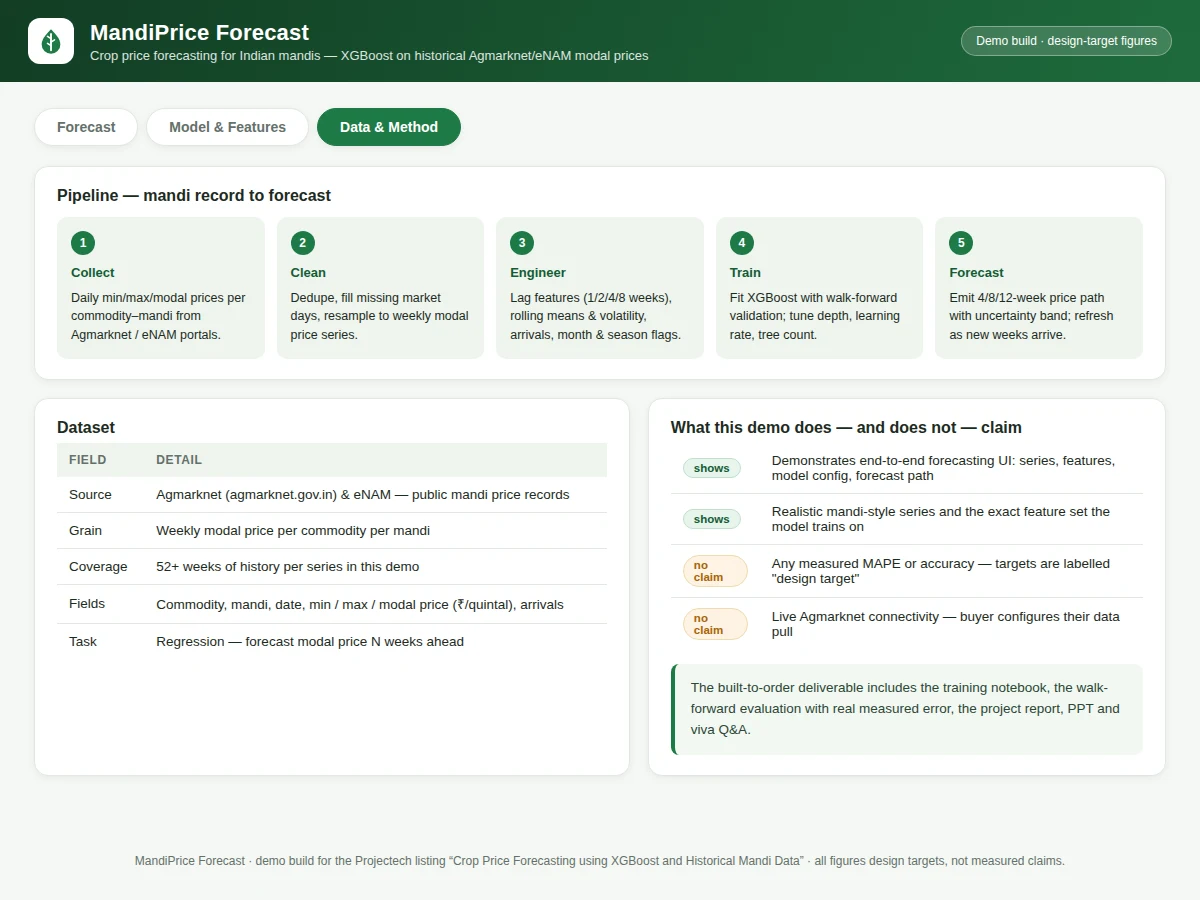
- Daily mandi records (commodity, mandi, min/max/modal price, arrivals) are pulled from the Agmarknet/eNAM public portals and loaded into the notebook.
- Records are deduplicated, missing market days are handled, and the series is resampled to a weekly modal-price series per commodity–mandi pair.
- Features are engineered per week: lags at 1/2/4/8 weeks, 4-week and 8-week rolling means and volatility, arrival volume, month and season flags, and a rainfall-anomaly indicator where available.
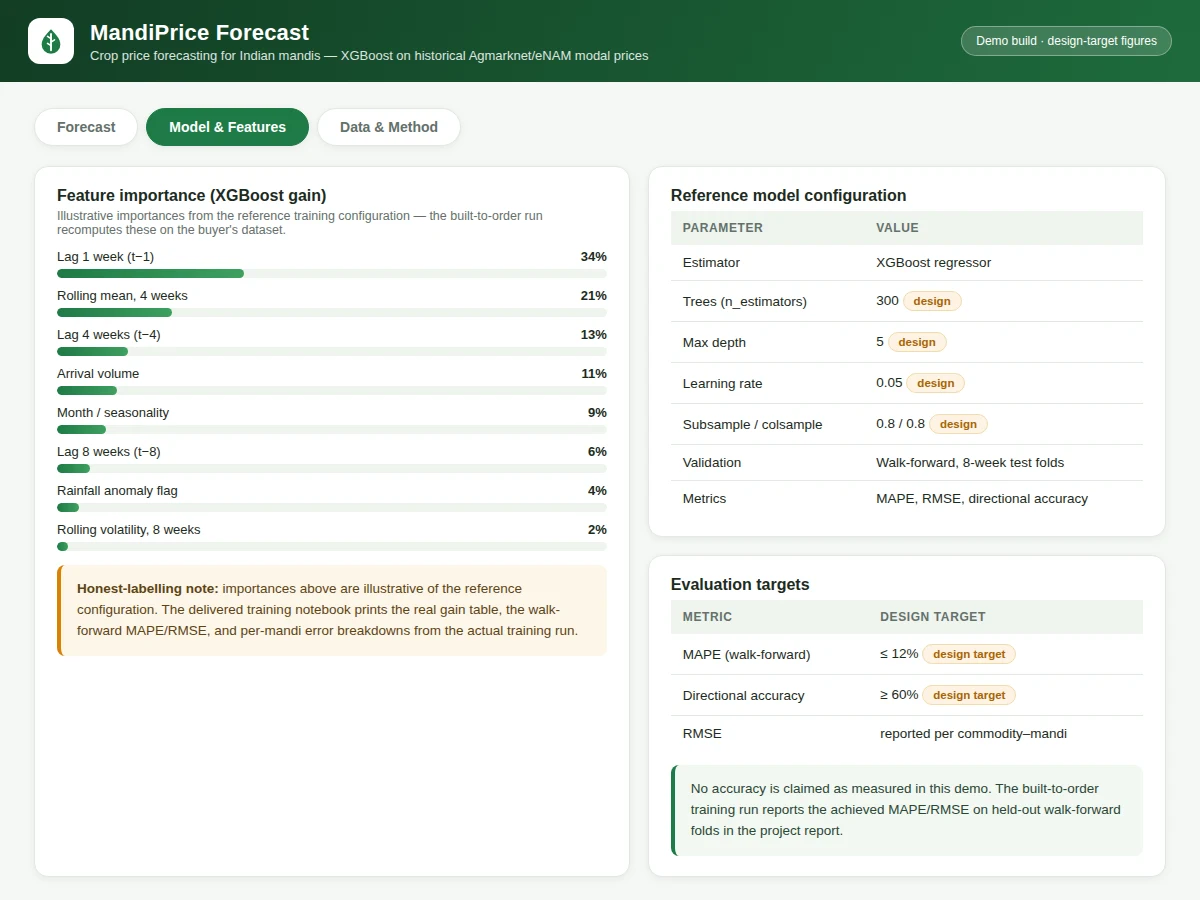
- An XGBoost regressor (300 estimators, max depth 5, learning rate 0.05, subsample 0.8) is trained on the feature matrix with walk-forward splits: each fold trains on history and tests on the next 8 unseen weeks.
- MAPE, RMSE and directional accuracy are computed per fold; feature importances and the worst-fold cases are logged for the report.
- The dashboard loads the trained model artifacts: selecting a commodity, mandi and horizon renders history plus the forecast path with its widening uncertainty band.
Tech stack:
- Python 3, XGBoost, scikit-learn
- pandas, NumPy (data pipeline)
- Matplotlib (evaluation plots)
- Jupyter Notebook (training & evaluation)
- HTML5 + JavaScript dashboard (canvas charts, single-file)
- Agmarknet / eNAM public mandi price records
Dataset & model details
- Dataset: Agmarknet (agmarknet.gov.in) and eNAM public mandi price records — daily commodity-wise, mandi-wise min/max/modal prices (₹/quintal) plus arrival volumes. The reference configuration covers commodities such as wheat, paddy, soybean, onion, cotton and turmeric across representative mandis (e.g. Lasalgaon/Nashik, Indore, Nagpur, Jaipur, Bengaluru, Erode), resampled to weekly modal-price series of 52+ weeks per commodity–mandi pair.
- Task: Regression — predict the weekly modal price N weeks ahead (4/8/12-week horizons); input = engineered feature vector for week t, output = modal price at week t+N.
- Model: XGBoost regressor — reference configuration 300 estimators, max_depth 5, learning_rate 0.05, subsample 0.8, colsample_bytree 0.8; walk-forward validation with expanding window and 8-week test folds.
- Metrics: MAPE (design target ≤ 12% on walk-forward folds), directional accuracy (design target ≥ 60%), RMSE reported per commodity–mandi. No accuracy is claimed as measured until the built-to-order training run executes — the report documents the actual achieved figures.
| Parameter | Value |
|---|---|
| Task | Weekly modal-price regression, 4/8/12-week horizons |
| Data source | Agmarknet / eNAM public mandi records |
| Series length | 52+ weeks per commodity–mandi pair (design) |
| Model | XGBoost, 300 trees, depth 5, lr 0.05 (design configuration) |
| MAPE target | ≤ 12% walk-forward (design target, not a measured claim) |
| Directional accuracy target | ≥ 60% (design target) |
| Features | Lags, rolling means/volatility, arrivals, seasonality (8 feature groups) |
| Dashboard | Single-file HTML/JS, canvas charts, runs offline after download |
| Training time | Approximately 5–15 min on a laptop CPU per commodity–mandi (expected) |
Project features
- [XGBoost forecasting model] Gradient-boosted tree regressor trained on engineered mandi features (lags, rolling statistics, arrivals, seasonality) with a documented hyperparameter set (300 trees, depth 5, lr 0.05).
- [Interactive forecast dashboard] Pick commodity, mandi and horizon (4/8/12 weeks); see history, the forecast path and an uncertainty band, plus current price and expected direction cards.
- [Agmarknet/eNAM data pipeline] Cleaning and resampling pipeline for public mandi records: dedupe, missing-day handling and weekly modal-price series construction, all in the notebook.
- [Walk-forward evaluation] Time-series-correct backtesting (expanding training window, 8-week test folds) with MAPE, RMSE and directional-accuracy reporting — the right way to evaluate a forecaster.
- [Feature importance] XGBoost gain-based importance table showing which signals drive the forecast (typically lag-1 and rolling means), included in the report.
- [Uncertainty bands] Forecast intervals widening with horizon, giving the student an honest way to discuss confidence in the viva.
- [Full training notebook] Data loading, feature engineering, model training, hyperparameter notes, evaluation and forecast export in one reproducible notebook.
What is included
- Data cleaning & resampling notebook for Agmarknet/eNAM records
- Feature-engineering and XGBoost training notebook with walk-forward evaluation
- Trained model artifacts for the chosen commodity–mandi pair(s)
- Interactive forecast dashboard (commodity/mandi/horizon, uncertainty bands)
- Evaluation plots: walk-forward error, feature importance, forecast-vs-actual
- Project report PDF (background, data pipeline, model theory, methodology, measured results)
- PPT presentation for final review
- Viva Q&A preparation document (XGBoost, time-series validation, MAPE vs RMSE, data leakage)
Limitations & prerequisites
- Forecasts are statistical, not advisory — mandi prices move on weather, policy and arrivals that no model fully captures; the dashboard states this plainly.
- MAPE ≤ 12% is a design target for the training run, stated honestly — the report documents the actual achieved figure from the walk-forward folds.
- Public Agmarknet data has gaps and reporting delays; the pipeline handles missing market days but cannot invent missing weeks.
- Modelled per commodity–mandi pair — a wheat model for Indore does not transfer to onion in Lasalgaon; each pair trains separately.
- This is a teaching and analysis build, not a trading system — no claim is made about real-world profit from the forecasts.
Frequently Asked Questions
Which dataset is used and is it real?
Agmarknet and eNAM — the government's public mandi price portals. They publish daily min, max and modal prices per commodity per mandi plus arrival volumes. The pipeline cleans and resamples these into weekly series, so every number the model trains on traces back to a public record.
Why XGBoost and not a neural network?
For tabular time-series features (lags, rolling means, arrivals), gradient-boosted trees are the empirically strong, fast-to-train baseline — they need no GPU, train in minutes on a laptop, and give honest feature-importance scores, which makes the viva discussion concrete.
How is the model evaluated honestly?
With walk-forward validation: the model trains only on past weeks and is tested on the next 8 unseen weeks, repeated across folds. This mirrors real forecasting and avoids the leakage of a random train/test split — the report shows the measured MAPE, RMSE and directional accuracy per fold.
What do the uncertainty bands mean?
The shaded band widens with horizon to show that a 12-week forecast is less certain than a 4-week one. It is a design-target interval for planning discussion, not a statistical guarantee, and the report explains how it is computed.
Can it forecast my local mandi's prices?
The built-to-order run trains on the commodity–mandi pair you choose, as long as Agmarknet/eNAM coverage exists for it. The dashboard supports swapping the series, and the notebook documents the data-pull steps.
Is this project suitable for a final-year project?
Yes — for Computer Science, IT and AI/ML programs. It covers real-world data engineering, feature engineering, gradient boosting, time-series-correct evaluation and a working dashboard, with an agriculture-economics angle that stands out in a viva. Suitable for B.E./B.Tech final-year projects in Computer Science, IT and AI & Machine Learning.
Components & software requirements
- Python 3, XGBoost, scikit-learn
- pandas, NumPy (data pipeline)
- Matplotlib (evaluation plots)
- Jupyter Notebook (training & evaluation)
- HTML5 + JavaScript dashboard (canvas charts, single-file)
- Agmarknet / eNAM public mandi price records
Dataset & model details
- Dataset: Agmarknet (agmarknet.gov.in) and eNAM public mandi price records — daily commodity-wise, mandi-wise min/max/modal prices (₹/quintal) plus arrival volumes. The reference configuration covers commodities such as wheat, paddy, soybean, onion, cotton and turmeric across representative mandis (e.g. Lasalgaon/Nashik, Indore, Nagpur, Jaipur, Bengaluru, Erode), resampled to weekly modal-price series of 52+ weeks per commodity–mandi pair.
- Task: Regression — predict the weekly modal price N weeks ahead (4/8/12-week horizons); input = engineered feature vector for week t, output = modal price at week t+N.
- Model: XGBoost regressor — reference configuration 300 estimators, max_depth 5, learning_rate 0.05, subsample 0.8, colsample_bytree 0.8; walk-forward validation with expanding window and 8-week test folds.
- Metrics: MAPE (design target ≤ 12% on walk-forward folds), directional accuracy (design target ≥ 60%), RMSE reported per commodity–mandi. No accuracy is claimed as measured until the built-to-order training run executes — the report documents the actual achieved figures.
Delivery information
Built-to-order project. Delivery timeline is shared after order confirmation based on current queue.
Support terms
Complete documentation, setup guide, and viva preparation included. Support for setup and explanation provided.
Download free synopsis (PDF)
Enter your name and email — the synopsis PDF downloads immediately. We may send occasional project updates; no spam, unsubscribe anytime.