
More project photos (2)
The problem
Recruiters increasingly look past marksheets at public proof of work: merged pull requests, reported issues and sustained open-source activity. But most students contribute sporadically — a docs fix here, a Hacktoberfest PR there — and lose track of what they did, where, and whether it was merged. When placement season arrives they cannot quantify their own open-source journey, and GitHub profiles alone do not tell the story a resume needs: merge rate, skills exercised, consistency over time. This project gives students a purpose-built log. Every contribution is recorded with repository, title, type, status and date; the dashboard aggregates totals, merged counts and streaks; a six-month activity heatmap shows consistency at a glance; and analytics views break the log down by month, contribution type and repository so weak spots in the portfolio become visible.
How it works
- The student opens the app and lands on the dashboard: stat cards, the filterable contribution table, the activity heatmap and a profile card.
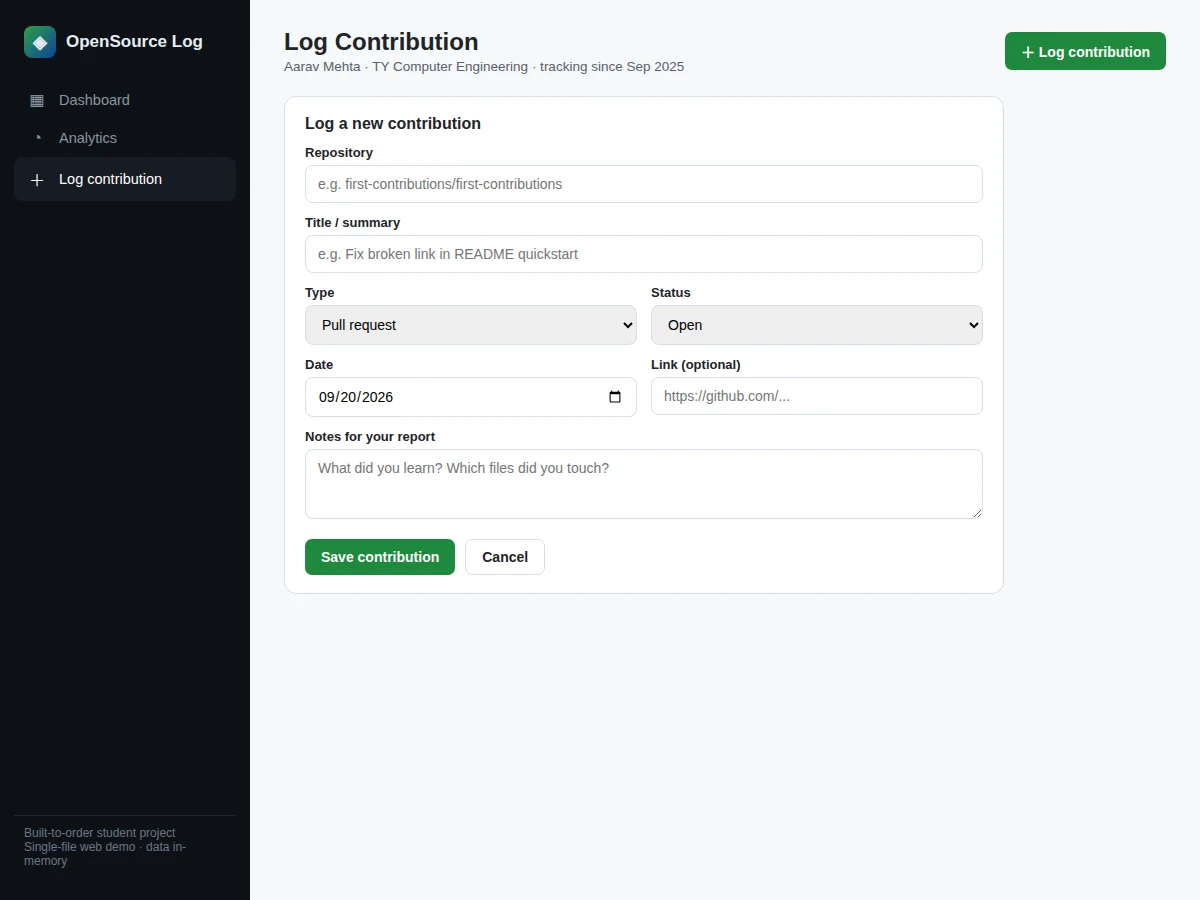
- New contributions are added through the log form — repository, title, type, status, date and optional notes — with validation on required fields.
- Every save updates a single in-memory data store; all views re-render from it, so counters, the heatmap and charts stay consistent.
- The status filter chips narrow the table to merged, open or closed entries; the search box matches titles and repository names.
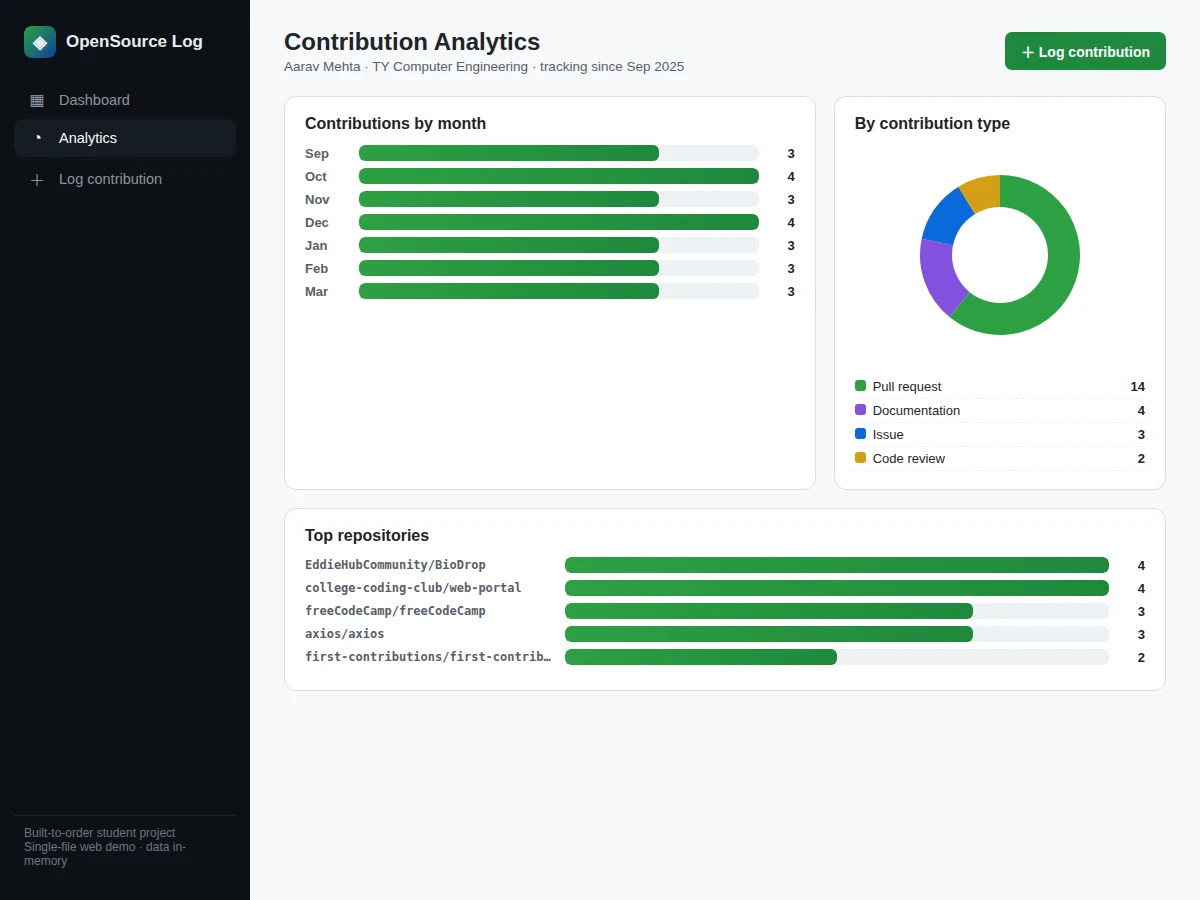
- The analytics view aggregates the store into monthly bars, a type-distribution donut and top-repository rankings.
- The printable report view formats the log as a one-page summary the student can attach to applications.
Tech stack:
- HTML5, CSS3, vanilla JavaScript (single-file app, no framework)
- SVG charts (heatmap, bars, donut — no external chart library)
- Hash-based client-side routing (dashboard / analytics / log views)
- Runs from any static host or directly as a local file
| Parameter | Value |
|---|---|
| App size | Single HTML file, approximately 20 KB |
| Views | 3 (dashboard, analytics, log form) |
| Contribution types | 4 (PR, issue, code review, documentation) |
| Status values | 4 (open, merged, closed, draft) |
| Heatmap window | 26 weeks, approximately 6 months (design target) |
| Chart rendering | Inline SVG, no external requests (expected) |
| Browser support | Any modern browser, Chrome/Firefox/Edge (expected) |
| Data persistence | In-memory session store; localStorage/backend as listed extension |
Project features
- [Contribution log with rich metadata] Every entry captures repository, title, type (pull request, issue, code review, documentation), status (open, merged, closed, draft) and date — the fields a placement interview actually asks about.
- [Dashboard with live statistics] Total contributions, merged-PR count, repository count and day streak recompute instantly whenever an entry is added or edited.
- [Six-month activity heatmap] A GitHub-style contribution grid with intensity bands that makes consistency — or gaps — visible at a glance.
- [Analytics views] Monthly contribution bars, a contribution-type donut chart and per-repository breakdowns, plus an automatic "revise next"-style callout for the weakest area.
- [Status filters and search] Filter the log by status and full-text search across titles and repository names to find any contribution in seconds.
- [Fast log form] A validated add-contribution form with type/status dropdowns and a notes field for recording what was learned — notes that feed directly into viva answers.
- [Printable contribution report] The log formats into a clean summary suitable for resumes and placement interviews.
What is included
- Complete working web app (single-file HTML/CSS/JS) with all three views
- Full source code with comments explaining the data model and chart logic
- Project report PDF (background, methodology, architecture, screens, testing notes)
- PPT presentation for final review
- Viva Q&A preparation document (open-source workflows, heatmap computation, aggregation logic)
Limitations & prerequisites
- The demo build keeps data in memory for the session — contributions do not persist across reloads until the localStorage/backend extension is implemented.
- No automatic GitHub API import yet; entries are logged manually (listed as future scope).
- The heatmap intensity bands are illustrative of the student's own log, not synced with github.com activity.
- Charts are rendered for typical student-scale data (tens of entries); very large logs may need pagination.
- The printable report is a clean summary, not a formatted resume template.
Frequently Asked Questions
How is this different from just looking at my GitHub profile?
GitHub shows raw activity; this app tells the story a resume needs — merge rates, contribution-type balance, per-repository depth and consistency over time — with filters, analytics and a printable report built for interviews.
Does it pull data from GitHub automatically?
Not in the delivered build — entries are logged manually through the form, which also captures learning notes GitHub cannot. GitHub API sync is documented as future scope in the report.
What analytics does it compute?
Totals, merged-PR counts, streaks, a six-month activity heatmap, monthly contribution bars, a type-distribution donut and per-repository rankings — all recomputed live from the log.
Can I use my own real contributions in it?
Yes — the log form accepts any repository and title, so the student fills it with their genuine Hacktoberfest, club and personal-project contributions.
What does the report include?
A background on open-source portfolios, the app's data model and architecture, screen walkthroughs, the aggregation logic behind each chart, and testing notes.
Is this project suitable for a final-year project?
Yes — for Computer Science, IT and Web Development programs. It demonstrates front-end architecture, data aggregation, SVG visualization and a real student-facing problem. Suitable for B.E./B.Tech final-year projects in Computer Science, IT and Web Development.
Components & software requirements
- HTML5, CSS3, vanilla JavaScript (single-file app, no framework)
- SVG charts (heatmap, bars, donut — no external chart library)
- Hash-based client-side routing (dashboard / analytics / log views)
- Runs from any static host or directly as a local file
Delivery information
Built-to-order project. Delivery timeline is shared after order confirmation based on current queue.
Support terms
Complete documentation, setup guide, and viva preparation included. Support for setup and explanation provided.