
More project photos (2)

The problem
Placement preparation fails most often not from lack of effort but from lack of direction. Students solve random problems, repeat comfortable topics, and discover their weak areas only in the interview room. Generic problem lists cannot tell a student that their dynamic programming sits at 20% while arrays are at 90% — so revision stays guesswork. This project turns practice into a measurable system. A curated bank of 48 DSA problems across 10 topics (arrays, strings, DP, graphs, trees, heaps, tries, design, searching, linked lists) carries topic, difficulty and status metadata on every question. The analytics view aggregates that metadata into per-topic completion bars sorted weakest-first, difficulty-split charts and a weekly activity strip, converting raw effort into a study plan: the next session targets the weakest link, not the most comfortable topic.
How it works
- The student opens the question bank: stat cards show solved, attempted and to-do counts over the 48-question dataset.
- Search and the three filter dropdowns narrow the table; clicking any row opens the question detail view.
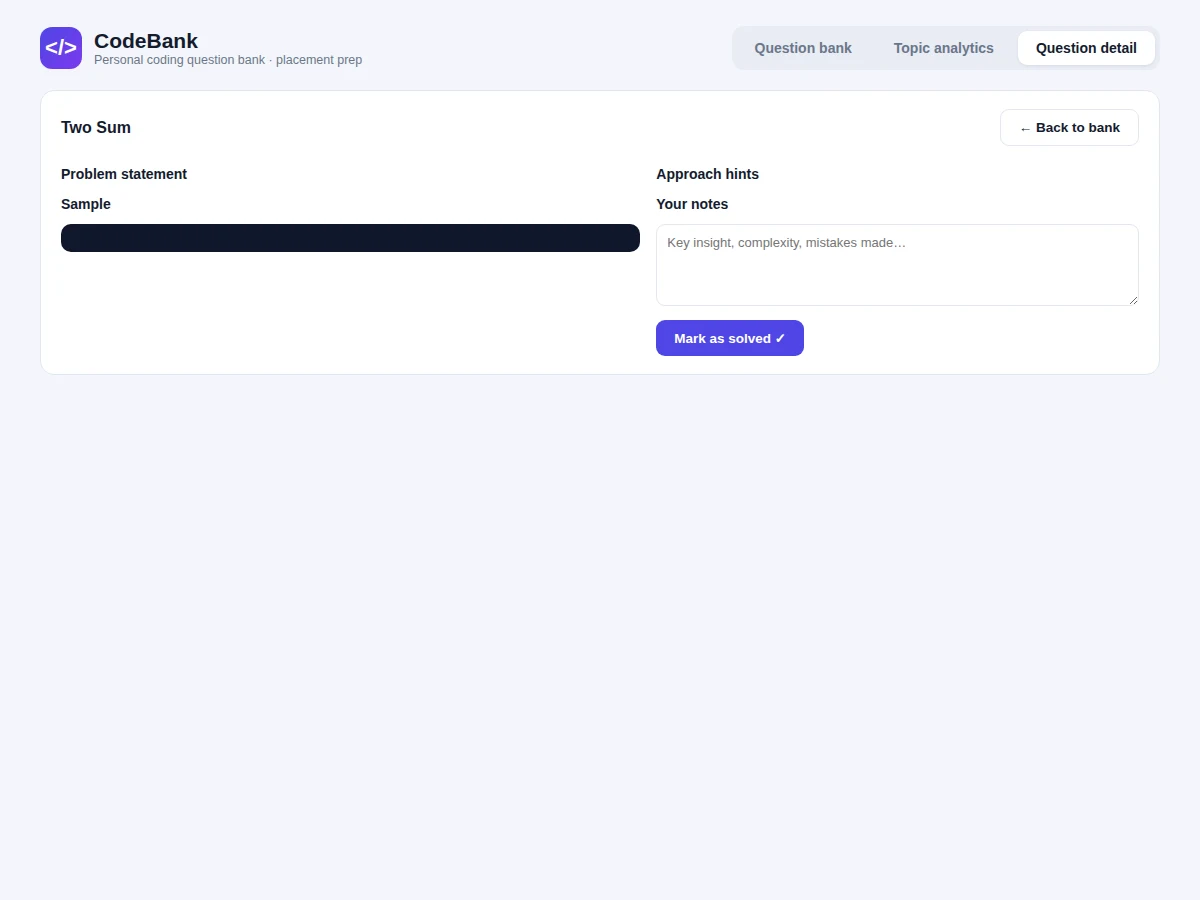
- The detail view presents the statement, sample I/O, approach hints and a notes field; marking solved updates the store.
- Every status change propagates to the statistics cards and re-renders the analytics views from the single question store.
- The analytics view computes completion ratios per topic, sorts them weakest-first, and renders SVG bar charts.
- The weekly activity strip and difficulty-split bars give the student a momentum check before each mock test.
Tech stack:
- HTML5, CSS3, vanilla JavaScript (single-file app, no framework)
- SVG bar charts and activity strips (no external chart library)
- Hash-based client-side routing (bank / analytics / detail views)
- Runs from any static host or directly as a local file
| Parameter | Value |
|---|---|
| Question count | 48 (design target, curated set) |
| Topics covered | 10 (arrays, strings, DP, graphs, trees, heaps, tries, design, searching, linked lists) |
| Difficulty levels | 3 (Easy / Medium / Hard) |
| Status values | 3 (Solved / Attempted / To do) |
| Views | 3 (bank, analytics, detail) |
| App size | Single HTML file, approximately 20 KB |
| Chart rendering | Inline SVG, no external requests (expected) |
| Browser support | Any modern browser, Chrome/Firefox/Edge (expected) |
Project features
- [48 curated DSA problems] Ten topics from arrays and strings to DP, graphs, trees, heaps, tries and system design — each with a one-line problem summary.
- [Topic, difficulty and status tagging] Every question carries its topic, an Easy/Medium/Hard rating and a Solved/Attempted/To-do status that drives all analytics.
- [Search and triple filters] Full-text search plus topic, difficulty and status dropdowns narrow the bank to exactly the practice set needed.
- [Question detail view] Problem statement, sample input/output, staged approach hints, a personal notes field and a mark-as-solved button that updates every view.
- [Topic-wise analytics] Per-topic completion bars sorted weakest-first, with an automatic "revise next" callout naming the three lowest topics.
- [Difficulty and activity charts] Solved counts split by difficulty and a seven-day activity strip for momentum tracking.
- [Live statistics] Solved/attempted/to-do counters recompute instantly as statuses change.
What is included
- Complete working web app (single-file HTML/CSS/JS) with all three views and the 48-question dataset
- Full source code with comments explaining the data model, filtering and analytics aggregation
- Project report PDF (background, methodology, architecture, screens, testing notes)
- PPT presentation for final review
- Viva Q&A preparation document (DSA topic taxonomy, analytics logic, design decisions)
Limitations & prerequisites
- The 48-question set is a curated starter bank, not an exhaustive interview list — students extend it with their own questions (import is listed as future scope).
- Data lives in the session; statuses reset on reload until persistence is added.
- Approach hints are staged guidance, not full editorial solutions — deliberate, to keep the practice honest.
- Analytics reflect logged statuses only; they cannot verify a solution's correctness.
- Sample I/O shown in the detail view is illustrative of the problem pattern.
Frequently Asked Questions
Where do the 48 questions come from?
They are a curated starter set covering the twelve topic areas placement interviews draw from most — arrays, strings, DP, graphs, trees and the rest — chosen for pattern coverage rather than volume.
How does the weak-area detection work?
The analytics view computes solved/total per topic, sorts topics by completion ratio, and names the three lowest as "revise next" — so the next session targets the weakest link first.
Can I add my own questions?
In the delivered build the dataset is fixed in the source (documented and easy to extend by editing the data array); CSV/JSON import is listed as future scope.
Does it check my solutions?
No — it is a practice-tracking system, not a judge. It tracks what you attempted and solved; correctness is verified on a coding platform of your choice.
What does the report include?
A background on structured interview prep, the question data model, the filtering and aggregation logic, screen walkthroughs and testing notes.
Is this project suitable for a final-year project?
Yes — for Computer Science, IT and Web Development programs. It demonstrates data modelling, client-side analytics, SVG visualization and a genuinely useful student tool. Suitable for B.E./B.Tech final-year projects in Computer Science, IT and Web Development.
Components & software requirements
- HTML5, CSS3, vanilla JavaScript (single-file app, no framework)
- SVG bar charts and activity strips (no external chart library)
- Hash-based client-side routing (bank / analytics / detail views)
- Runs from any static host or directly as a local file
Delivery information
Built-to-order project. Delivery timeline is shared after order confirmation based on current queue.
Support terms
Complete documentation, setup guide, and viva preparation included. Support for setup and explanation provided.