
More project photos (2)
The problem
Computer-networks courses teach the TCP/IP stack from diagrams, but students rarely see real packets: what an ARP request looks like on the wire, how a DNS query is structured, or what a TCP handshake actually contains. Wireshark exists, yet it is a finished product — it does not teach how capture, filtering and decoding work, and it cannot be submitted as a student's own build. This project fills that gap: a working packet sniffer written in Python with Scapy that captures live traffic, applies BPF filters, decodes each layer of every packet and presents the results in a purpose-built dashboard. Because the student builds the capture pipeline themselves, they can explain sniffing, filtering and protocol dissection from first principles in the viva — exactly the concepts the subject is meant to teach.
Chooses the interface and filters, clicks packets to inspect, saves captures.
Follow the working sequence
How it works
- The user selects a network interface and an optional BPF filter string, then starts the capture (administrator/root privileges are required by the OS).
- Scapy's sniff() opens the interface and passes each raw frame to the capture callback.
- Every packet is decoded layer by layer: Ethernet, then IPv4, then TCP/UDP/ICMP, then application protocols such as DNS or HTTP.
- Decoded packets are appended to the live table with timestamp, endpoints, protocol, length and a Wireshark-style info string (e.g. "Standard query A github.com").
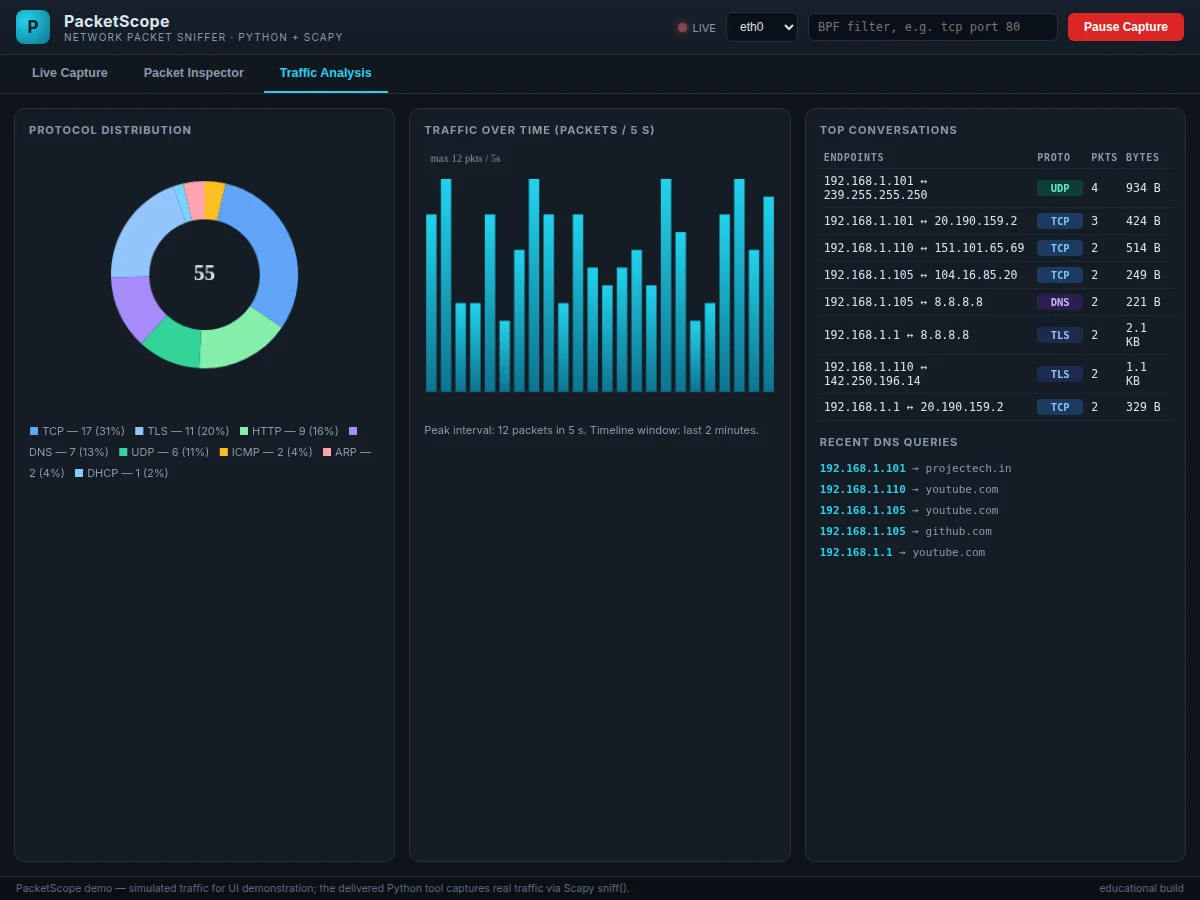
- The protocol classifier tallies counts and shares and redraws the breakdown charts in real time.
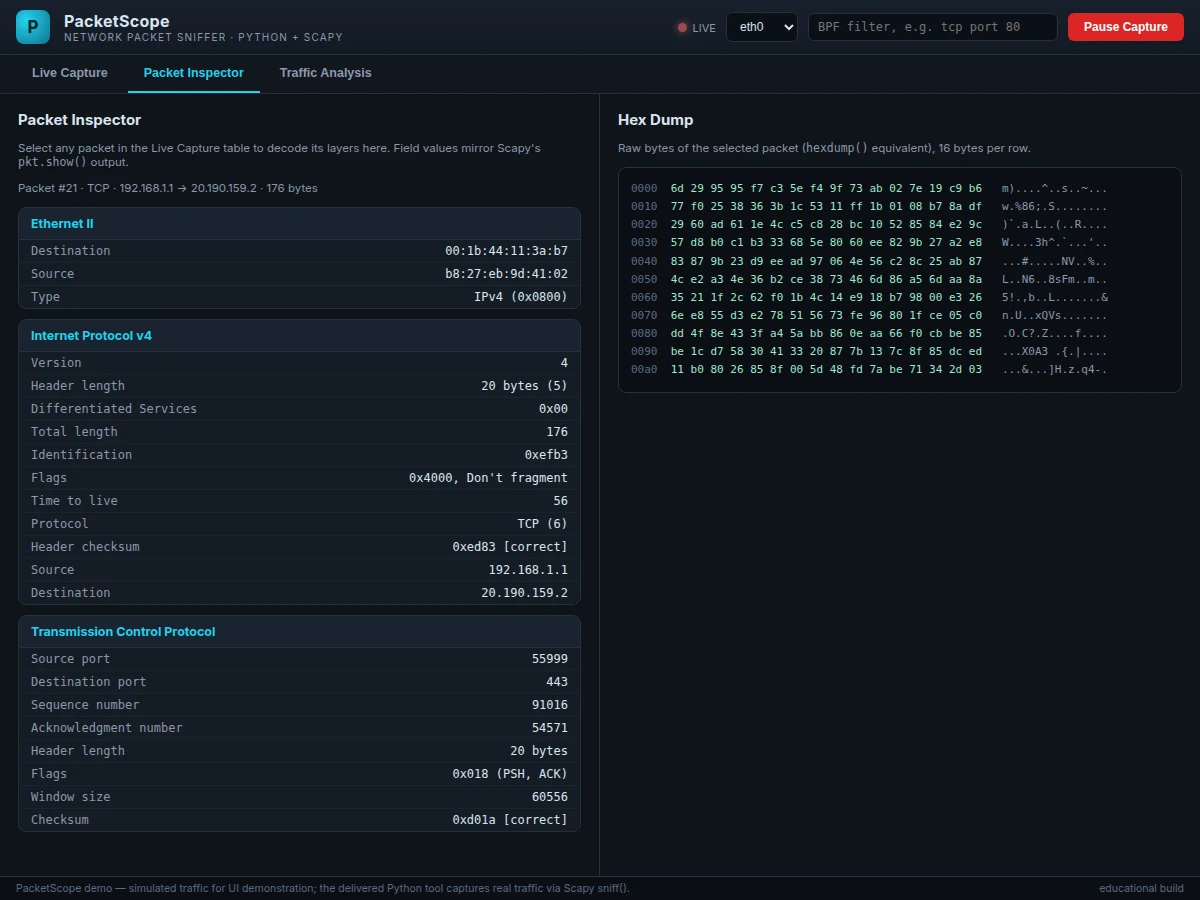
- Clicking a row opens the inspector: full layer field values plus a hex dump of the raw bytes.
- On stop, the session can be saved to .pcap via wrpcap and reloaded later with rdpcap for offline analysis.
Tech stack:
- Python 3
- Scapy (sniff, layer decoding, wrpcap/rdpcap)
- BPF (Berkeley Packet Filter expressions)
- Tkinter (desktop dashboard)
- Matplotlib (traffic charts)
- PCAP file format
- HTML/JavaScript (dashboard UI demo)
| Parameter | Value |
|---|---|
| Language | Python 3.9+ (design target) |
| Capture engine | Scapy sniff() — latest stable Scapy 2.x installed via pip (design target) |
| Capture rate | Approximately 50–500 packets/sec on a typical lab laptop (design target; traffic-dependent) |
| Protocols decoded | 8: TCP, UDP, DNS, ICMP, ARP, DHCP, HTTP, TLS |
| Dashboard | Desktop GUI with live table, inspector and analysis views |
| Capture format | .pcap via Scapy wrpcap/rdpcap |
| Privileges | Administrator/root required for live capture (OS requirement) |
| Platforms | Windows, Linux, macOS (design target; Npcap required on Windows) |
Project features
- [Live packet capture] Uses Scapy's sniff() to capture packets on a chosen network interface, displaying each packet's number, timestamp, source and destination addresses, protocol and length in a live-updating table.
- [BPF capture filters] Accepts Berkeley Packet Filter expressions such as "tcp port 80" or "icmp" to target specific traffic; the report documents the most useful filters for lab exercises.
- [Protocol breakdown] Groups captured traffic by protocol (TCP, UDP, DNS, ICMP, ARP, DHCP, HTTP, TLS) with counts and percentage share, rendered as live-updating bar and donut charts.
- [Packet inspector] Clicking any packet decodes its layers — Ethernet II, IPv4, TCP/UDP/ICMP and DNS/HTTP fields — alongside a 16-bytes-per-row hex dump, mirroring Scapy's show() and hexdump() output.
- [Traffic analysis view] Top conversations, top talkers, a packets-over-time timeline and a recent-DNS-queries list, giving quick situational awareness during lab capture sessions.
- [PCAP save and reload] Sessions are written to .pcap with wrpcap and can be re-opened with rdpcap, so captures can be analyzed offline and replayed during the viva.
- [Search and protocol filters] Live text search across addresses and info strings plus one-click protocol filter chips, so a specific host or conversation can be isolated in seconds.
- [Configurable capture session] Interface, packet-count and timeout limits, and filter expressions are all adjustable through settings without touching code.
What is included
- Complete Python source code (capture engine, protocol decoders, desktop dashboard)
- Dashboard UI demo showing the live-capture, inspector and analysis views
- Setup and lab-exercise guide (interface setup, BPF examples, Npcap notes for Windows)
- Sample .pcap capture files for offline practice and viva replay
- Project report PDF (networking background, Scapy methodology, capture walkthrough, analysis)
- PPT presentation for final review
- Viva Q&A preparation document (sniffing, BPF, TCP/IP layers, protocol fields, limitations)
- Delivery timeline: built to order in approximately 2–3 weeks, with the source, report and viva kit prepared fresh for each order
- Support: guided setup assistance plus viva Q&A preparation until submission
Limitations & prerequisites
- Live capture requires administrator/root privileges; without them only saved .pcap files can be opened and analyzed.
- On switched networks the tool sees the host's own traffic unless a mirror/SPAN port is configured — a lab-network constraint, not a tool defect.
- Encrypted payloads (TLS/HTTPS) cannot be decrypted; only headers and handshake metadata are visible.
- Very high traffic rates can drop packets on modest hardware; the design target is a few hundred packets per second, and capture filters reduce the load.
- Wireless capture depends on the adapter's monitor-mode support, which varies by hardware and driver.
- MAC/IP addresses and traffic in the demo are simulated; the delivered Python tool captures the buyer's own real traffic.
- This is an educational network analyzer, not a hardened security product — no intrusion-detection or threat-blocking claims are made.
Frequently Asked Questions
Is this project suitable for a final-year project?
Yes — for Computer Science, IT and Computer Engineering programs. It demonstrates packet sniffing, BPF filtering, protocol decoding and traffic analysis, which are the core practical concepts of any computer-networks course.
Does it capture real network traffic?
Yes. The delivered Python build uses Scapy's sniff() on a real interface, so it captures the buyer's own live traffic (administrator/root privileges required). The UI demo ships with simulated traffic to show the dashboard layout.
What is a BPF filter and why does it matter?
BPF (Berkeley Packet Filter) is the same filter syntax tcpdump and Wireshark use — for example, "tcp port 80" captures only web traffic. The project documents the most useful filters and explains how they work, which is strong viva material.
Can it decrypt HTTPS traffic?
No. TLS payloads appear as encrypted bytes with handshake metadata only. Decryption is not implemented and is listed as future scope in the report.
What will I receive with the project?
Complete Python source, the dashboard, setup and lab-exercise guide, sample .pcap files, project report PDF, PPT and a viva Q&A document — everything prepared fresh for the order.
Can this project be customized?
Yes. Realistic customizations include alert rules (e.g. flagging repeated SYN packets), additional protocol decoders, session-statistics export to CSV/HTML and dashboard layout changes.
Components & software requirements
- Python 3
- Scapy (sniff, layer decoding, wrpcap/rdpcap)
- BPF (Berkeley Packet Filter expressions)
- Tkinter (desktop dashboard)
- Matplotlib (traffic charts)
- PCAP file format
- HTML/JavaScript (dashboard UI demo)
Delivery information
Built-to-order project. Delivery timeline is shared after order confirmation based on current queue.
Support terms
Complete documentation, setup guide, and viva preparation included. Support for setup and explanation provided.
Download free synopsis (PDF)
Enter your name and email — the synopsis PDF downloads immediately. We may send occasional project updates; no spam, unsubscribe anytime.