
More project photos (2)
The problem
The Log File Anomaly Detection System with Isolation Forest is a software project that reads server and application log files, converts every log line into eight numerical features, and scores each line with an unsupervised Isolation Forest so the handful of unusual entries — a credential scan, a slow endpoint, a burst of 500 errors — rise to the top of an operator's triage queue. It is built for students who want to learn unsupervised anomaly detection on real operational data: the Python pipeline parses Apache combined, nginx combined and timestamped app-log formats, extracts features such as response time, status class, burstiness and suspicious-path tokens, and trains a scikit-learn IsolationForest on the log window itself. A triage dashboard plots the score timeline, ranks flagged lines with their top signals, and explains each flag against normal-line means. No labels are required and no accuracy is quoted — the project ships an evaluation protocol that measures precision and recall on injected incidents.
Raw Apache, nginx or application log lines waiting to be analysed.
Follow the working sequence
How it works
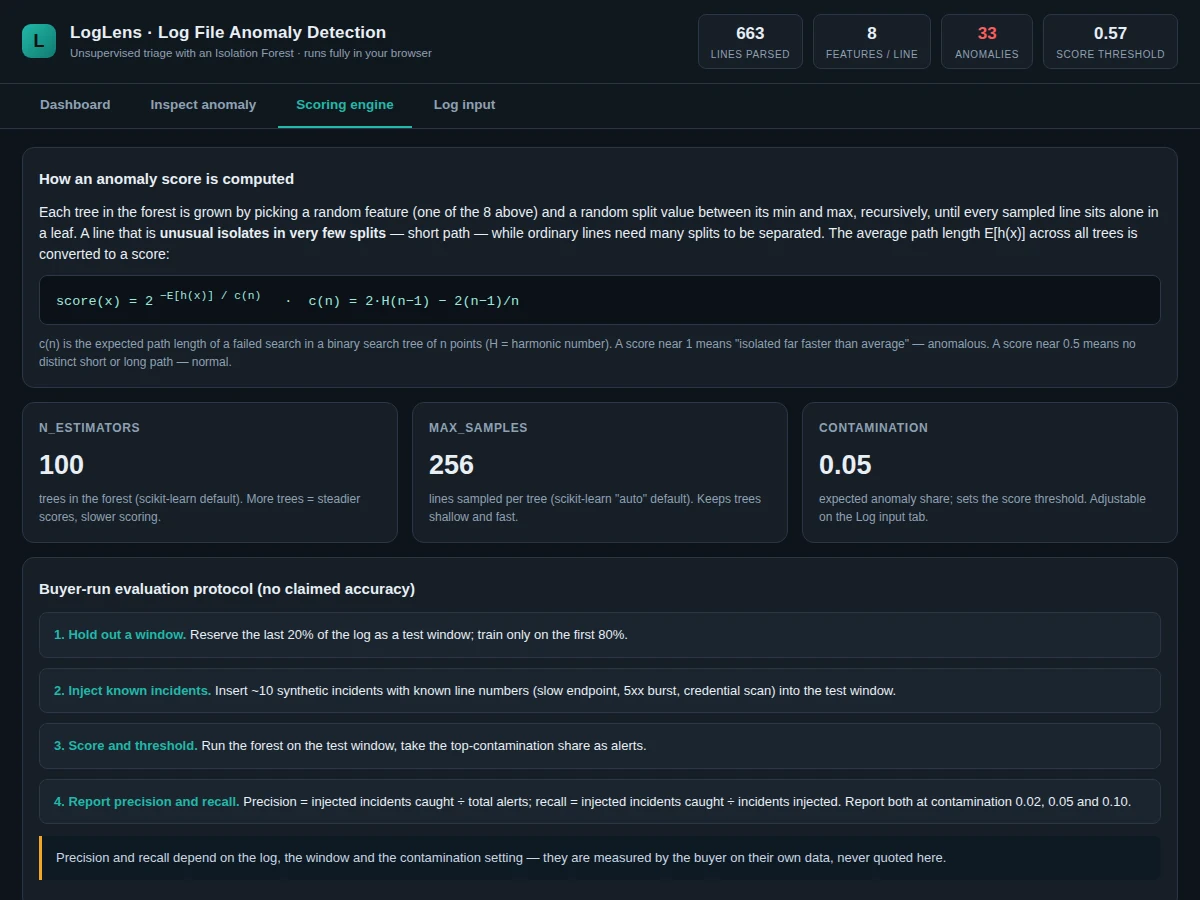
A log line enters as raw text and leaves as a ranked anomaly score. The parser first identifies each line's format — Apache combined, nginx combined, or a timestamped app-log entry — and folds multiline stack-trace continuations into the parent event, because treating each traceback line as its own event poisons the burstiness feature. Each event becomes eight normalized numeric features capturing timing, status, size, burstiness, time-of-day and textual risk signals. The Isolation Forest grows 100 trees, each on a random 256-line sample, splitting recursively on a random feature at a random split value until every sampled line sits alone in a leaf. A line's average path length E[h(x)] across all trees becomes its score via 2^(−E[h(x)]/c(n)): ordinary lines need many splits and score near 0.5, while unusual lines isolate in a few splits and score toward 1. The contamination setting marks the top-scoring share as anomalies, and the dashboard explains each flag by showing exactly which features deviated.
- Paste or upload log lines (or load the bundled ~660-line synthetic Apache log); the parser detects the format per line and folds multiline stack traces into the parent event.
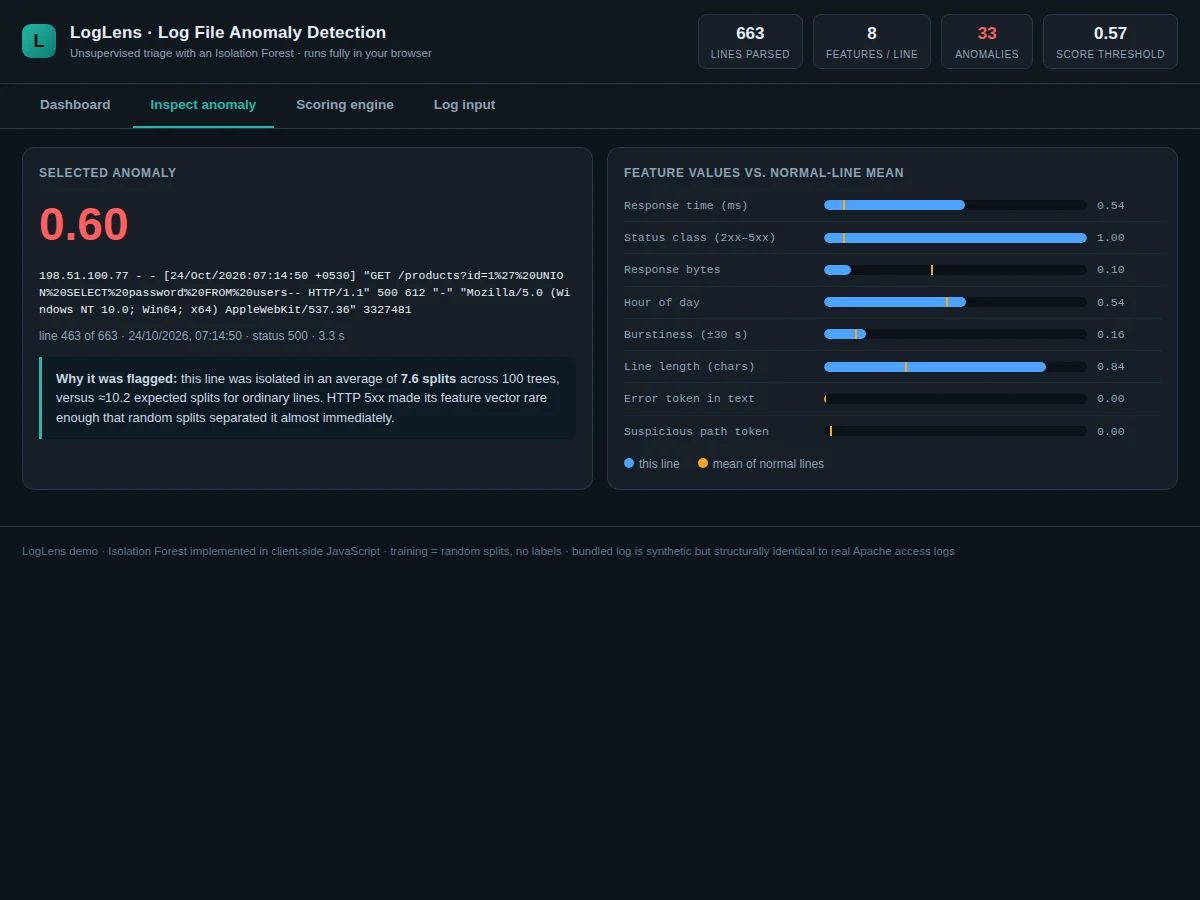
- Each event is converted into an 8-feature vector — response time, status class, response bytes, hour of day, burstiness (±30 s), line length, error-token flag, suspicious-path-token flag — min-max normalized across the window.
- The Isolation Forest grows 100 trees; each tree samples up to 256 lines and recursively splits on a random feature at a random split value until sampled lines sit alone in leaves.
- Every line's average path length E[h(x)] across the trees converts to score(x) = 2^(−E[h(x)]/c(n)); fast isolation (short paths) pushes the score toward 1.
- The contamination setting (default 0.05 in the demo) places the threshold at the top-scoring share; lines above it are flagged for triage.
- The dashboard plots the score timeline, ranks flagged lines with their top signals, and the inspect view compares each flag's features against normal-line means.
Tech stack:
- Python 3
- scikit-learn · Isolation Forest
- pandas · NumPy
- Apache · nginx log formats
- HTML5 · JavaScript demo
- Matplotlib
- Git
Dataset & model details
- Dataset: Custom synthetic corpus (~660 Apache combined access-log lines with injected incident clusters: credential scan, slow report endpoint, checkout 500 burst, SQLi probes, giant upload) plus the buyer's own server/application logs. No public labeled dataset is used — Isolation Forest is unsupervised and defines "normal" from the majority of the analysis window itself.
- Task: Unsupervised anomaly scoring; input = one parsed log line as an 8-feature vector, output = anomaly score in [0, 1] plus a ranked triage list of flagged lines with top contributing signals.
- Model: scikit-learn IsolationForest (n_estimators = 100, max_samples = "auto" = 256 lines per tree, contamination set explicitly — demo default 0.05; scikit-learn's own default is 'auto' since v0.22). The demo runs an equivalent forest in client-side JavaScript.
- Metrics: Precision and recall measured by the buyer on injected incidents at contamination 0.02, 0.05 and 0.10 (documented protocol). No accuracy is quoted as a project claim.
| Parameter | Value |
|---|---|
| Log formats | Apache combined (%D), nginx combined, timestamped app logs |
| Features per line | 8 (response time, status class, bytes, hour, burstiness, line length, error token, suspicious-path token) |
| Model | IsolationForest (scikit-learn; n_estimators = 100 default) |
| Samples per tree | 256 lines (scikit-learn "auto" default) |
| Contamination | Adjustable 0.01–0.20 (demo default 0.05); set explicitly per run |
| Bundled demo log | Approximately 660 Apache access-log lines (synthetic, with injected incidents) |
| Score range | 0–1 per line (higher = more anomalous) |
| Demo runtime | Browser-only, no server required (expected) |
Project features
The system combines four capabilities that make the project genuinely instructive: a multi-format log parser that handles the messy reality of real logs (three formats, multiline stack traces, microsecond-vs-second response-time fields); an eight-feature extraction stage that turns unstructured text into a numeric vector the forest can split on; a triage dashboard that ranks anomalies, draws the score timeline, and explains each flag feature-by-feature so the student can defend every detection in the viva; and adjustable forest parameters (contamination, tree count) that make the sensitivity trade-off tangible. A fifth strength is honesty about evaluation: instead of a quoted accuracy, the project ships a documented buyer-run protocol that measures precision and recall on incidents the buyer injects themselves — a skill viva examiners probe, since unsupervised methods live or die by how they are evaluated.
- [Multi-format log parser] Reads Apache combined (with %D), nginx combined and timestamped app-log lines; continuation lines from multiline stack traces are folded into the parent event instead of becoming fake events.
- [Eight-feature extraction] Every line becomes a numeric vector: response time, status class, response bytes, hour of day, burstiness within ±30 seconds, line length, error-token flag and suspicious-path-token flag — min-max normalized per analysis window.
- [Isolation Forest scoring] A scikit-learn IsolationForest (n_estimators = 100, max_samples = 256, adjustable contamination) scores each line as 2^(−E[h(x)]/c(n)); lines isolated in few random splits score near 1.
- [Triage dashboard] A single-file web app plots the anomaly-score timeline with the contamination threshold, lists flagged lines ranked by score, and shows each line's top contributing signals.
- [Per-anomaly explanation] The inspect view compares the flagged line's eight features against normal-line means and reports its average isolation depth versus the expected c(n) — the mechanism behind the score, made visible.
- [Adjustable forest parameters] Contamination (0.01–0.20) and tree count (50–200) are adjustable in the dashboard; re-running re-trains and re-scores the pasted or uploaded log in the browser.
- [Buyer-run evaluation protocol] A documented four-step procedure: hold out a log window, inject ~10 known incidents, threshold the top-contamination share, and report precision and recall at three contamination levels. Implemented as a documented procedure with demo support; no accuracy is quoted as a project claim.
What is included
- Python pipeline source: parser, feature extraction, IsolationForest scoring, evaluation-protocol script
- Bundled synthetic Apache log (~660 lines with injected incident clusters)
- Live triage dashboard as a single-file web app
- Project report PDF (background, unsupervised anomaly-detection theory, feature design, methodology, evaluation protocol)
- PPT presentation for final review
- Viva Q&A preparation document (isolation depth, contamination, why no accuracy is quoted)
- Downloadable project abstract PDF
- Implementation support during the build with a documented delivery timeline
Limitations & prerequisites
- Unsupervised means it flags rarity, not malice — a legitimate traffic spike can score high; triage judgment stays with the operator.
- Contamination is an operator-set prior (demo default 0.05; this project always sets it explicitly — scikit-learn's own default is 'auto'), not a measured anomaly rate; the threshold moves with it.
- "Normal" is defined by the majority of the supplied window — a log that is mostly attack traffic trains a blind model.
- No accuracy is claimed anywhere; precision and recall are measured by the buyer on their own data through the documented protocol.
- The parser covers three log formats; proprietary or custom formats need a new regex at the documented extension point.
- The in-browser demo comfortably handles a few thousand lines; very large logs (100,000+ lines) should use the Python pipeline (expected).
- Message-embedding features (TF-IDF/transformers) are future scope — the current feature set uses token flags, not semantic similarity.
Frequently Asked Questions
Which dataset is used?
No public labeled dataset is used — this project is unsupervised, so the Isolation Forest defines "normal" from the majority of the log window itself and labels are never required. It ships with a bundled synthetic Apache access log of about 660 lines containing injected incident clusters (a credential scan, a slow report endpoint, a checkout 500 burst, SQLi probes and a giant upload), and it analyses the buyer's own application logs. The evaluation protocol then injects known incidents into a held-out window and measures how many are caught, so the buyer validates on their own data.
Which model is used and how does it score a line?
scikit-learn's IsolationForest with n_estimators = 100 and max_samples = 256 lines per tree. Each tree recursively splits the feature space on a random feature at a random split value, and a line that is unusual gets isolated in very few splits. The average path length E[h(x)] across all trees becomes the score via 2^(−E[h(x)]/c(n)), where c(n) is the expected path length of a binary-search-tree search — scores near 1 mean "isolated far faster than average". The demo runs an equivalent forest in client-side JavaScript so the scoring can be explored interactively.
Is the accuracy guaranteed?
No — no accuracy is quoted anywhere, because detection quality depends on the log, the window and the contamination setting. The project ships a buyer-run evaluation protocol instead: hold out 20% of the log, inject about 10 known incidents, threshold the top-contamination share, and report precision and recall at contamination 0.02, 0.05 and 0.10 on the buyer's own data. This makes the evaluation honest and reproducible, and it gives the student a strong viva talking point.
Can it work on my own server logs?
Yes for the three supported formats: Apache combined (with %D), nginx combined, and timestamped application logs — paste or upload them in the dashboard and the analysis re-runs in the browser. Proprietary or custom formats need one new regex added at the documented parser extension point, a realistic small customization. Multiline stack traces fold into their parent event automatically, and the features re-normalize to each new window so the forest adapts to the log's own traffic pattern.
Is this project suitable for a final-year project?
Yes — for Computer Science, IT and AI & Machine Learning programs. It demonstrates unsupervised learning, feature engineering on unstructured text, honest evaluation without invented accuracy, and a working triage dashboard. Students learn how random-split isolation turns into a score, why contamination is a prior rather than a measurement, and how to evaluate an unsupervised system honestly. The viva kit covers isolation depth, the contamination parameter and the evaluation protocol in depth. Because the demo runs entirely in the browser, the student can demonstrate the full pipeline live during the review.
Components & software requirements
- Python 3
- scikit-learn · Isolation Forest
- pandas · NumPy
- Apache · nginx log formats
- HTML5 · JavaScript demo
- Matplotlib
- Git
Dataset & model details
- Dataset: Custom synthetic corpus (~660 Apache combined access-log lines with injected incident clusters: credential scan, slow report endpoint, checkout 500 burst, SQLi probes, giant upload) plus the buyer's own server/application logs. No public labeled dataset is used — Isolation Forest is unsupervised and defines "normal" from the majority of the analysis window itself.
- Task: Unsupervised anomaly scoring; input = one parsed log line as an 8-feature vector, output = anomaly score in [0, 1] plus a ranked triage list of flagged lines with top contributing signals.
- Model: scikit-learn IsolationForest (n_estimators = 100, max_samples = "auto" = 256 lines per tree, contamination set explicitly — demo default 0.05; scikit-learn's own default is 'auto' since v0.22). The demo runs an equivalent forest in client-side JavaScript.
- Metrics: Precision and recall measured by the buyer on injected incidents at contamination 0.02, 0.05 and 0.10 (documented protocol). No accuracy is quoted as a project claim.
Delivery information
Built-to-order project. Delivery timeline is shared after order confirmation based on current queue.
Support terms
Complete documentation, setup guide, and viva preparation included. Support for setup and explanation provided.
Download free synopsis (PDF)
Enter your name and WhatsApp number — the synopsis PDF downloads immediately. We may send occasional project updates on WhatsApp; no spam.