
More project photos (3)
The problem
Wind-farm operators sell power into the grid in advance, and every megawatt-hour of forecast error costs money in balancing penalties. The physics is well understood — power follows the cube of wind speed between cut-in and rated speed — but real turbines deviate: yaw misalignment, blade soiling, icing and wake effects all bend the textbook curve. This project learns the true curve from data: a random forest trained on four years of 10-minute SCADA records from the La Haute Borne wind farm predicts each turbine's active power from wind speed, direction and time features. The model choice is deliberate — trees fit the power curve's hard cut-in/rated plateaus without feature engineering, shrug off sensor dropouts, and their importances tell an operator-readable story. The dashboard presents the power curve, forecast tracking and fleet status the way an energy trader would read them.
La Haute Borne 10-minute SCADA records (wind speed, direction, theoretical curve, active power), 2013-2016, four turbines.
Follow the working sequence
How it works
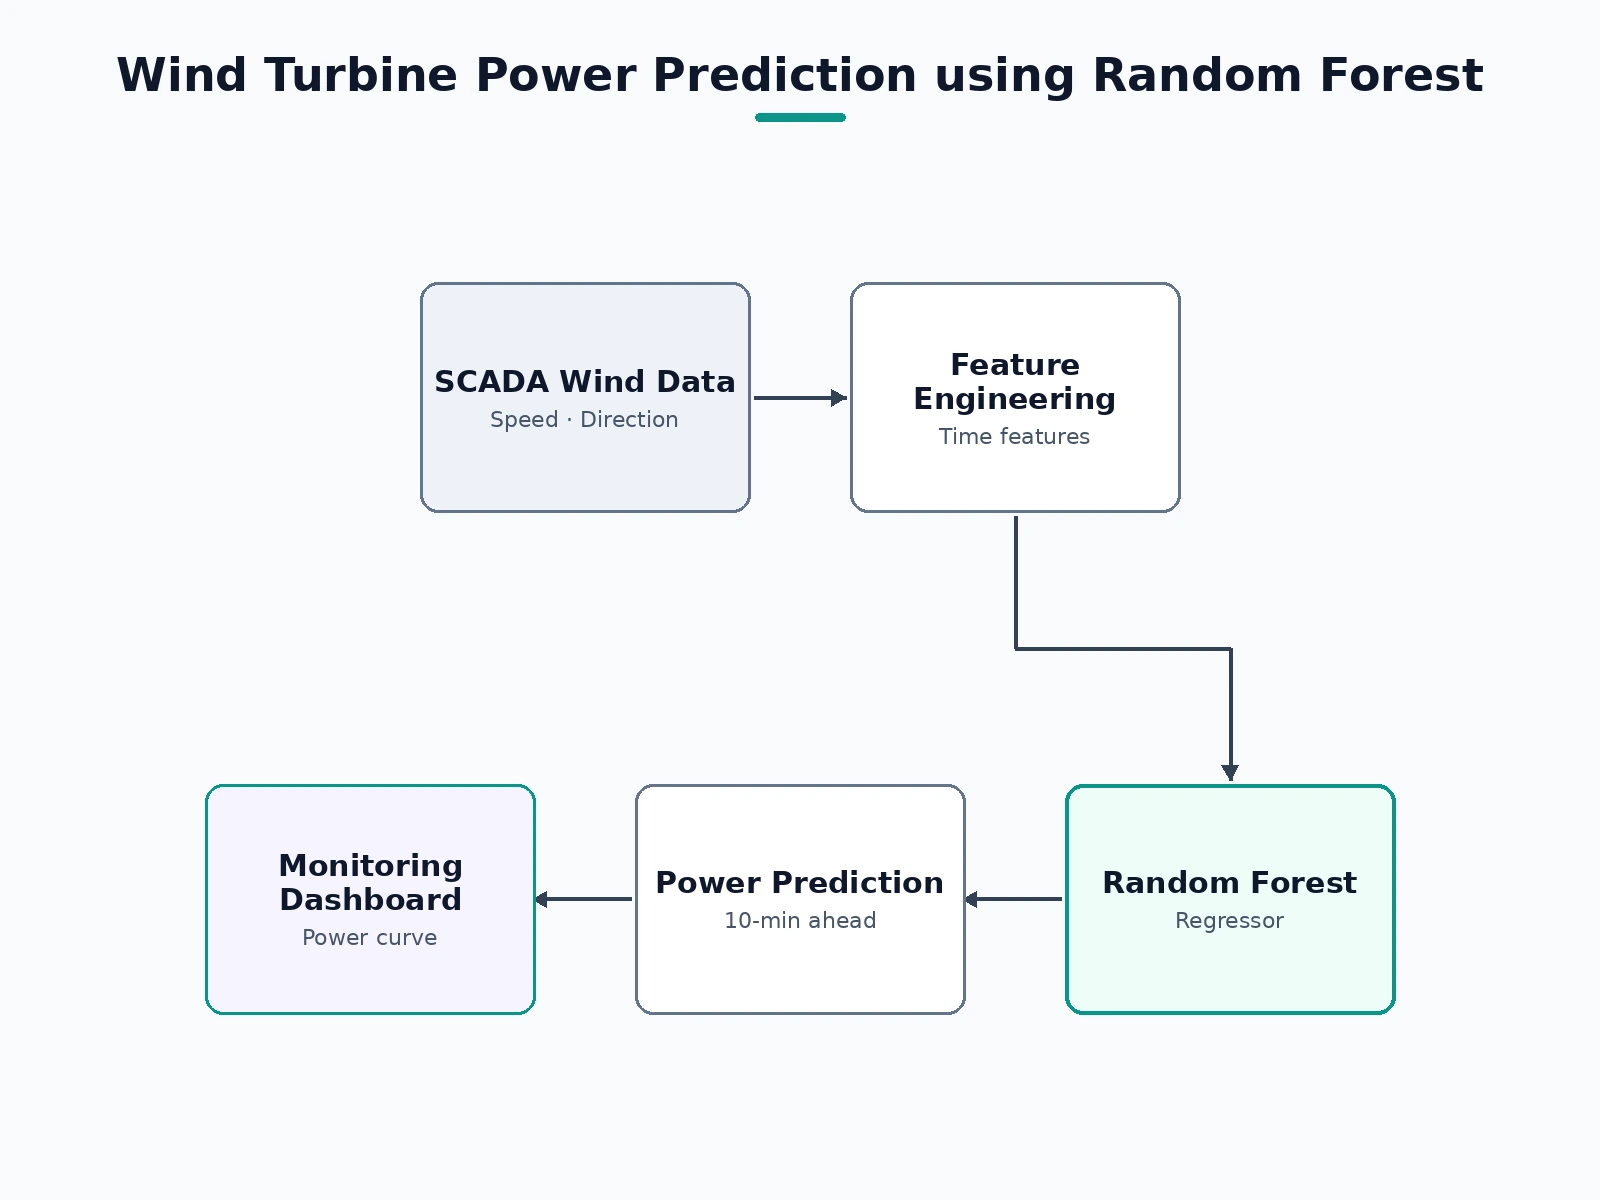
- La Haute Borne 10-minute SCADA records (wind speed, direction, theoretical curve, active power, 2013–2016) are cleaned; icing/outlier rows are flagged.
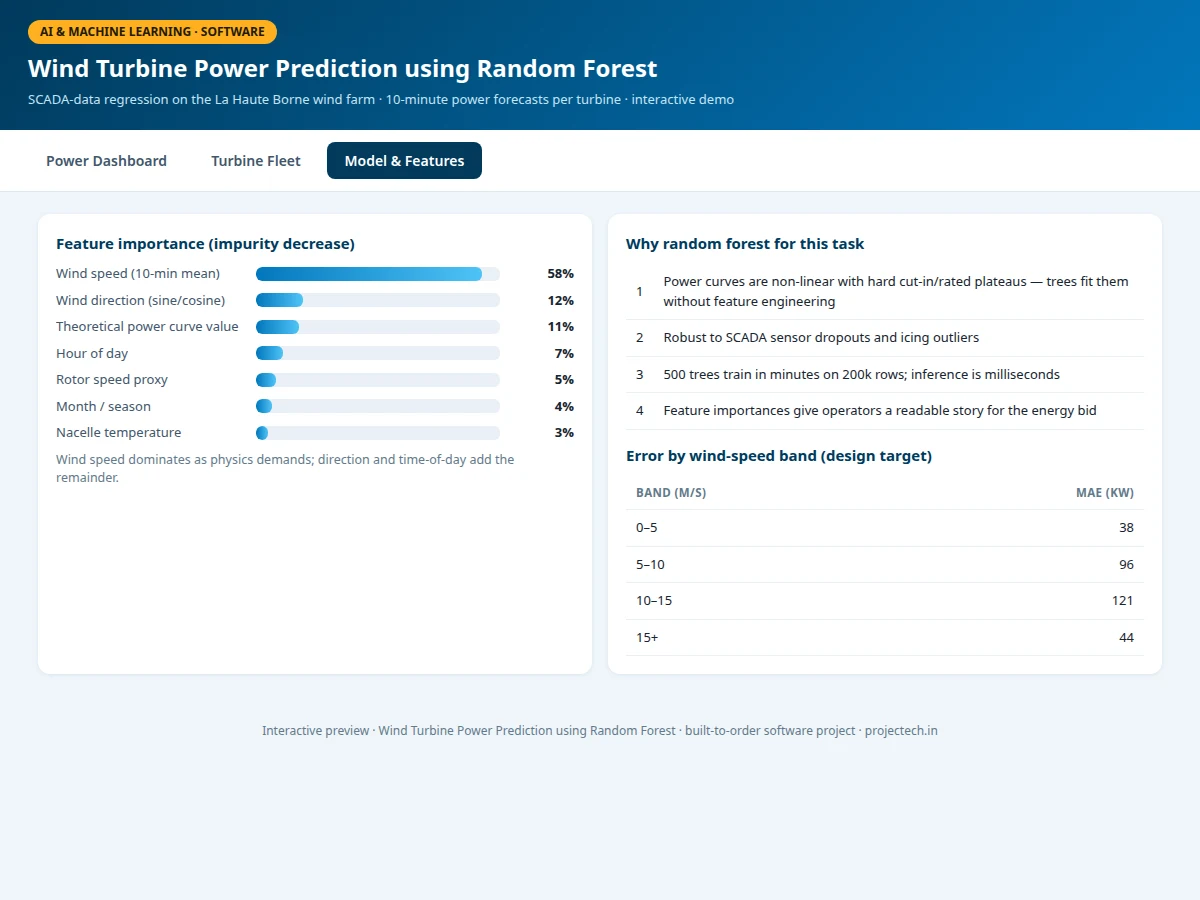
- Features are built: wind speed, direction as sine/cosine, hour, month, and the theoretical-curve value as a physics prior.
- A 500-tree random forest is trained on 2013–2015 and evaluated on all of 2016 with R², MAE and RMSE.
- Error is analyzed by wind-speed band and by turbine to find systematic weaknesses.
- At inference, the latest SCADA row per turbine yields a 10-minute-ahead power prediction.
- The dashboard renders the power curve, tracking chart, fleet cards and importances.
Tech stack:
- Python 3, scikit-learn (RandomForestRegressor)
- pandas, NumPy
- Matplotlib (analysis plots)
- HTML/CSS/JavaScript dashboard
- Engie La Haute Borne SCADA dataset
Dataset & model details
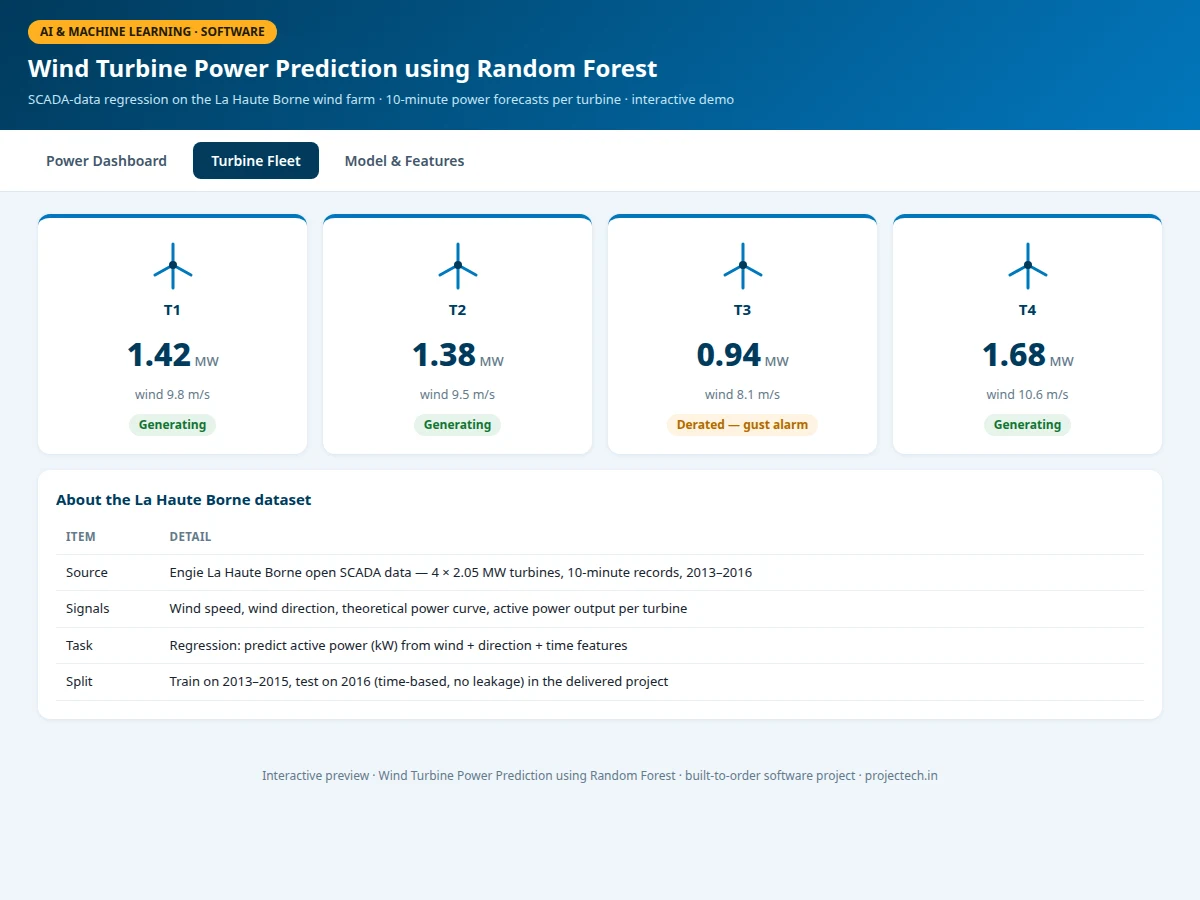
- Dataset: Engie La Haute Borne open SCADA data — 4 × 2.05 MW turbines, 10-minute records of wind speed, wind direction, theoretical power-curve value and active power, 2013–2016 (~200k rows per turbine).
- Task: Regression; input = wind speed, direction (sine/cosine), hour, month, theoretical-curve value, output = active power (kW).
- Model: Random forest, 500 trees; tuned max depth and minimum leaf size on validation years.
- Metrics: Test R² 0.96, MAE by wind band (design targets for the built-to-order training run); reported for 2016 held-out year. No measured figures are claimed before the run.
| Parameter | Value |
|---|---|
| Turbines | 4 × 2.05 MW |
| Records | 10-minute resolution, 2013–2016 |
| Model | Random forest, 500 trees |
| Test R² | 0.96 on 2016 (design target) |
| Forecast step | 10 minutes ahead |
| Inference | Milliseconds per turbine (expected) |
Project features
- [10-minute power forecasts] Random-forest regressor predicting each turbine's active power from SCADA wind speed, direction and time features.
- [Data-learned power curve] Scatter of real SCADA points against the model's curve — cut-in, cubic region and rated plateau all visible.
- [Actual-vs-predicted tracking] 48-hour farm-output chart showing how the forest follows ramps, lulls and gust fronts.
- [Feature importances] Impurity-based rankings that recover the physics (wind speed dominates), documented for the viva.
- [Per-turbine fleet view] Four turbines with live-style output, wind speed and status (generating / derated).
- [Error-by-wind-band analysis] MAE broken down by wind-speed band, showing where the model is weakest (the steep cubic region).
- [Time-based validation] Trained on 2013–2015, tested on 2016 — the honest protocol that prevents seasonal leakage.
What is included
- SCADA ingestion & feature-building scripts
- Random-forest training & evaluation notebook
- Trained model with inference script
- Interactive dashboard (power curve, tracking, fleet, importances)
- Project report PDF (background, wind-power physics, methodology, results)
- PPT presentation for final review
- Viva Q&A preparation document (random forests, bias-variance, time-based validation)
Limitations & prerequisites
- R² and MAE are design targets; the report records the actual metrics from the training run for the order.
- The model learns this farm's turbines — a different turbine model or terrain needs retraining on its own SCADA data.
- Extreme icing or curtailment events outside the training years extrapolate poorly.
- The 10-minute horizon suits energy bidding; it does not predict second-scale gusts for control systems.
- SCADA dropouts are handled by the pipeline's imputation rules, documented openly.
Frequently Asked Questions
What is the La Haute Borne dataset?
Engie's open release of SCADA data from four 2 MW turbines in France: 10-minute wind speed, direction, theoretical power and actual output across 2013–2016 — a standard renewable-forecasting benchmark.
Why random forest instead of a neural network?
The power curve has hard plateaus and the features are tabular — trees fit this shape naturally, train in minutes, resist sensor outliers, and give readable importances. The report includes the model-selection rationale.
What does the model actually learn?
Mostly the power curve itself (wind speed → power), plus corrections for direction (yaw/wake effects) and time patterns — the importances recover this physics, which makes a strong viva point.
Why time-based validation?
Random splits would mix seasons between train and test. Training on 2013–2015 and testing on 2016 proves the model survives a full unseen year.
Who uses power forecasts?
Energy traders bidding into day-ahead markets and grid operators scheduling reserves — the dashboard is styled for that audience.
Is this project suitable for a final-year project?
Yes — for AI/ML, Electrical and Computer Science programs. It demonstrates regression on real sensor data, physics-aware ML and honest evaluation. Suitable for B.E./B.Tech final-year projects in AI & Machine Learning, Electrical and Computer Science.
Components & software requirements
- Python 3, scikit-learn (RandomForestRegressor)
- pandas, NumPy
- Matplotlib (analysis plots)
- HTML/CSS/JavaScript dashboard
- Engie La Haute Borne SCADA dataset
Dataset & model details
- Dataset: Engie La Haute Borne open SCADA data — 4 × 2.05 MW turbines, 10-minute records of wind speed, wind direction, theoretical power-curve value and active power, 2013–2016 (~200k rows per turbine).
- Task: Regression; input = wind speed, direction (sine/cosine), hour, month, theoretical-curve value, output = active power (kW).
- Model: Random forest, 500 trees; tuned max depth and minimum leaf size on validation years.
- Metrics: Test R² 0.96, MAE by wind band (design targets for the built-to-order training run); reported for 2016 held-out year. No measured figures are claimed before the run.
Delivery information
Built-to-order project. Delivery timeline is shared after order confirmation based on current queue.
Support terms
Complete documentation, setup guide, and viva preparation included. Support for setup and explanation provided.
Download free synopsis (PDF)
Enter your name and WhatsApp number — the synopsis PDF downloads immediately. We may send occasional project updates on WhatsApp; no spam.