
More project photos (2)
The problem
Cricket fans argue endlessly about who will win a match, and broadcasters now show live win-probability graphics during games — but students rarely get to build the model behind that number. Guessing from gut feel or team loyalty is not a method, and the few online "predictors" are black boxes with no explanation of features or evaluation. This project builds the predictor properly: the public Kaggle IPL dataset (1,000+ matches and 250,000+ ball-by-ball deliveries from 2008 to 2023) is cleaned, features are engineered from venue, toss, historical team strength and live match state (runs, overs, wickets, required run rate), and a Random Forest classifier is trained to output a win probability for each side. A web demo makes the model tangible — set up a pre-match scenario or drag sliders through a live chase and see the probability respond. Because everything is built in the open with standard tools (Python, scikit-learn), the student can genuinely explain every feature, every metric and every limitation in the viva.
Kaggle IPL data 2008-2023: matches.csv with 1,000+ matches and deliveries.csv with 250,000+ deliveries.
Follow the working sequence
How it works
- The Kaggle IPL dataset is loaded: matches.csv (season, venue, team1, team2, toss_winner, toss_decision, winner, target_runs — 1,000+ matches) and deliveries.csv (inning, batting_team, bowling_team, over, total_runs, is_wicket — 250,000+ deliveries), covering seasons 2008–2023.
- Rows are cleaned (no-result and tied edge cases handled explicitly) and one training row is built per match state: pre-match rows use venue, toss and team strengths; in-play rows add current score, overs elapsed, wickets lost and required run rate.
- Team strength features are computed from historical win rates inside the training split only, so no future information leaks into the features.
- The data is split by season (earlier seasons train, later seasons test) so the evaluation measures how the model performs on genuinely unseen, later cricket.
- A Random Forest classifier (design: 200 trees, tuned depth) is trained on the training seasons and evaluated once on the held-out seasons: accuracy, precision/recall, ROC-AUC and a calibration plot.
- The trained model is serialized and wired into the web demo: the demo takes the same feature vector from the user's match setup or chase sliders and returns the forest's win probability for each side.
Tech stack:
- Python 3, scikit-learn (Random Forest)
- pandas, NumPy (data prep & feature engineering)
- Jupyter Notebook (training & evaluation)
- Matplotlib (evaluation plots, calibration curve)
- HTML/CSS/JavaScript (interactive prediction demo)
- Kaggle IPL match & ball-by-ball dataset (2008–2023)
Dataset & model details
- Dataset: Kaggle IPL match & ball-by-ball dataset, seasons 2008–2023 — matches.csv with 1,000+ matches (columns include season, venue, team1, team2, toss_winner, toss_decision, winner, result_margin, target_runs) and deliveries.csv with 250,000+ deliveries (columns include inning, batting_team, bowling_team, over, total_runs, is_wicket). Public open dataset.
- Task: Binary classification — given a match state (pre-match or in-play), predict whether the batting/chasing side wins. Input = engineered feature vector (venue, toss winner/decision, dataset team-strength index, current score, overs elapsed, wickets lost, required run rate); output = win probability per side (mean vote across trees).
- Model: Random Forest classifier (design: 200 trees, tuned max depth and minimum samples per leaf). Training rows are built per match state from both tables; team-strength features are computed from the training seasons only to avoid leakage; evaluation uses a season-based holdout (later seasons unseen).
- Metrics: Held-out accuracy (design target ≈62–66%, stated as a target — the report documents the actually achieved figure after the training run), precision/recall, ROC-AUC, feature importances and a calibration plot. No accuracy is claimed as measured until the training run is executed for the order.
| Parameter | Value |
|---|---|
| Dataset | Kaggle IPL matches.csv (1,000+ matches) + deliveries.csv (250,000+ deliveries), 2008–2023 |
| Task | Binary classification: batting/chasing side wins or loses |
| Model | Random Forest, 200 trees (design), tuned depth |
| Held-out accuracy | Design target ≈62–66% (target, not a measured claim) |
| Evaluation | Season-based holdout; precision/recall, ROC-AUC, calibration plot |
| Inference | Sub-second per prediction on a laptop CPU (expected) |
| Model file | Approximately 5–20 MB serialized forest (expected, depends on depth) |
| Demo | Single-file web app; runs offline after download |
Project features
- [Random Forest win-probability model] A Random Forest classifier trained on engineered match-state features — input is the venue, toss, team strengths and live score/overs/wickets; output is the win probability for each side. The notebook documents the train/test split and every hyperparameter choice.
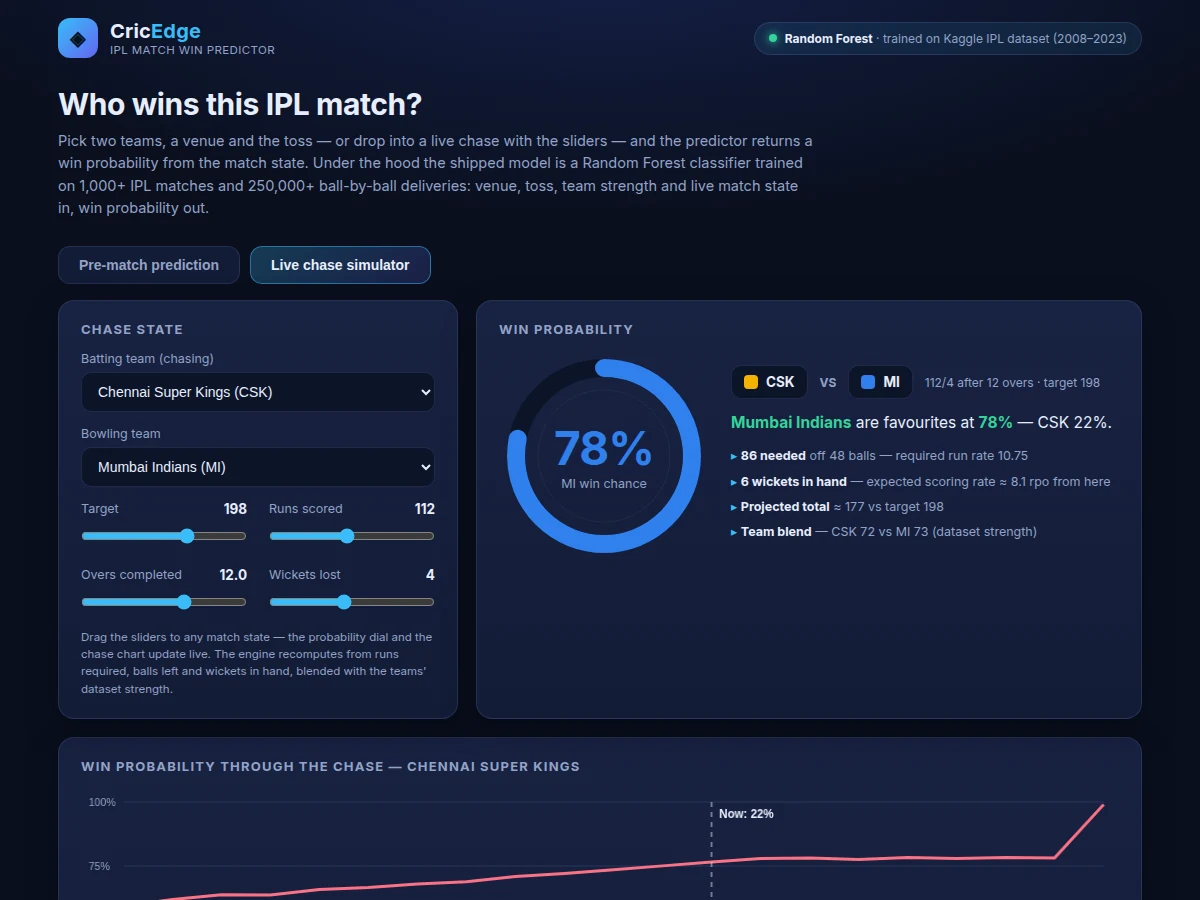
- [Live chase simulator demo] An interactive web demo: pick the chasing and bowling teams, set the target, then drag sliders for runs, overs and wickets and watch the win probability and the probability-through-the-chase chart update instantly.
- [Pre-match prediction mode] Enter two teams, the venue and the toss result to get a pre-match win probability with the contributing factors (dataset team strength, home advantage, toss effect) listed and explained.
- [Full training & evaluation notebook] Data loading and cleaning, feature engineering from matches.csv and deliveries.csv, model training, and evaluation — held-out accuracy, precision/recall, ROC-AUC and a calibration plot — in one reproducible Jupyter notebook.
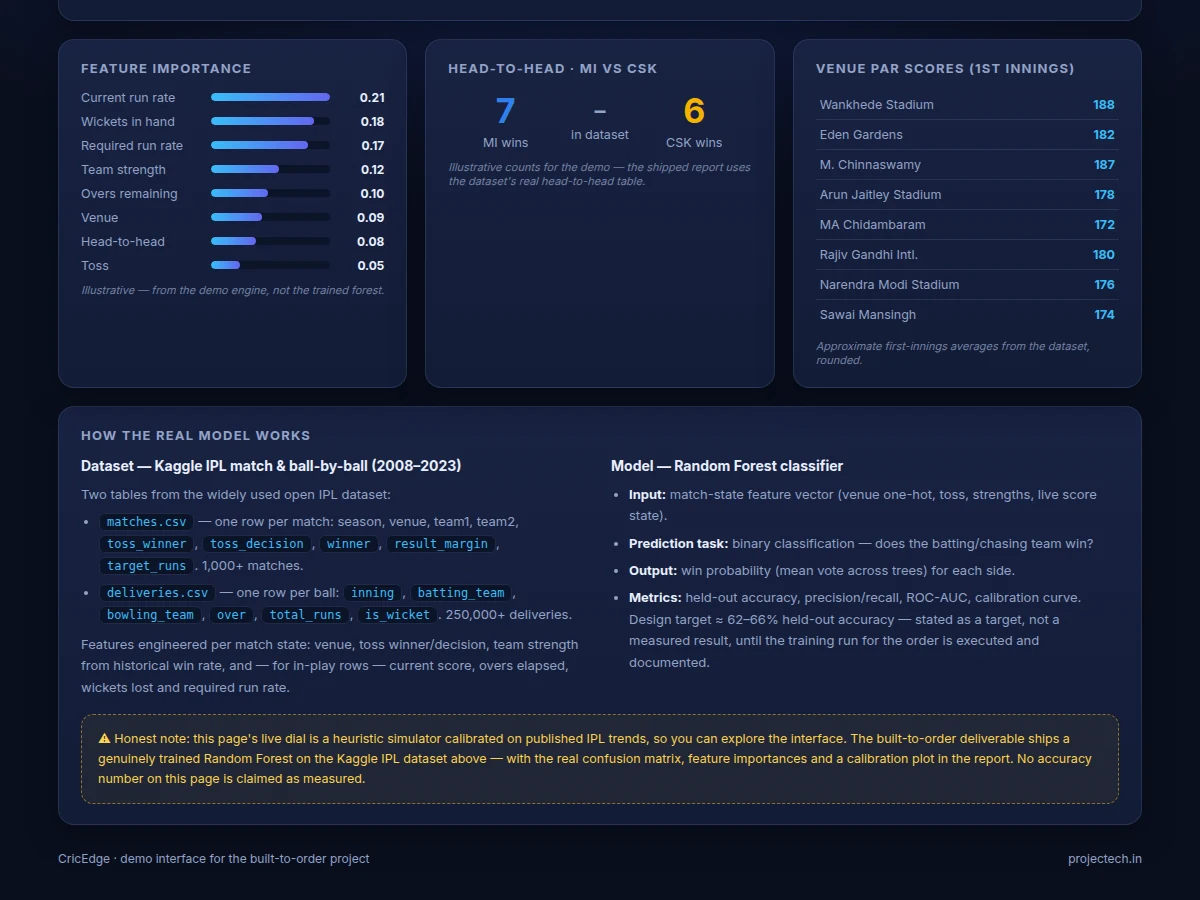
- [Feature importance analysis] The forest's feature importances are extracted and plotted, so the report can show exactly which signals drive predictions (typically required run rate, wickets in hand and current run rate) — a strong viva talking point.
- [Honest limitation reporting] The report states the design target (≈62–66% held-out accuracy) as a target and documents the actually achieved figure after the training run, with an explicit section on what the model cannot capture.
- [Viva-ready documentation] The methodology, every feature definition, the evaluation protocol and the limitation analysis are written up so the student can defend the project confidently.
What is included
- Complete data-preparation, feature-engineering and training Jupyter notebook
- Trained Random Forest model file with the inference pipeline
- Interactive web demo (pre-match predictor + live chase simulator) wired to the trained model
- Evaluation artefacts: held-out metrics, confusion matrix, ROC curve, calibration plot, feature-importance chart
- Project report PDF (background, dataset documentation, methodology, results with the honestly achieved figures, limitations)
- PPT presentation for final review
- Viva Q&A preparation document (Random Forest theory, feature engineering, leakage avoidance, evaluation protocol)
Limitations & prerequisites
- Cricket has high irreducible randomness — one brilliant over or a dropped catch flips matches no feature set can see; even a well-built model lands in the low-to-mid 60s on held-out accuracy, and the report says so plainly.
- The model only knows what the dataset records: player form on the day, injuries, pitch deterioration and weather are not features, so a last-minute team change can invalidate a prediction.
- Trained on IPL T20 data only — it does not transfer to ODIs, Tests or other leagues without retraining on their data.
- The 62–66% figure is a design target, stated honestly — the report documents the actual achieved held-out accuracy after the training run for the order.
- The demo's live dial is a heuristic simulator for exploring the interface; the shipped model is the genuinely trained forest, and the two are labelled as such.
- New franchises and renamed teams have thin history in the dataset, so their strength features are less reliable than those of long-running teams.
Frequently Asked Questions
Which dataset is used and what does it contain?
The public Kaggle IPL dataset covering 2008–2023: matches.csv with 1,000+ matches (season, venue, teams, toss_winner, toss_decision, winner, target_runs) and deliveries.csv with 250,000+ ball-by-ball rows (inning, batting_team, bowling_team, over, total_runs, is_wicket). It is the standard open dataset for IPL analytics projects.
Is the accuracy guaranteed?
No — and any project that guarantees accuracy is misleading you. Cricket is inherently noisy, so the honest design target is ≈62–66% held-out accuracy. The report documents the actually achieved figure from the training run done for your order, with the full evaluation protocol.
How does the model avoid "cheating" with future data?
Team-strength features are computed from the training seasons only, and evaluation uses a season-based holdout — the model is tested on later seasons it never saw during training. The notebook documents this leakage-avoidance explicitly.
Can it predict live during an actual match?
The demo's chase simulator accepts any match state (runs, overs, wickets, target) and returns a probability, so yes for exploration. A production live-ball feed integration is not part of the base project and is listed as future scope.
Can the model be retrained on newer seasons or another league?
Yes — the notebook is parameterized by season range, so adding newer IPL seasons is straightforward. Another league (e.g. BBL, PSL) needs its own ball-by-ball dataset in the same shape; that retraining is offered as a customization.
Is this project suitable for a final-year project?
Yes — for Computer Science, IT and AI/ML programs. It demonstrates dataset handling at scale, feature engineering, leakage-aware evaluation, ensemble methods and a working deployment demo, all defensible in a viva. Suitable for B.E./B.Tech final-year projects in Computer Science, IT and AI & Machine Learning.
Components & software requirements
- Python 3, scikit-learn (Random Forest)
- pandas, NumPy (data prep & feature engineering)
- Jupyter Notebook (training & evaluation)
- Matplotlib (evaluation plots, calibration curve)
- HTML/CSS/JavaScript (interactive prediction demo)
- Kaggle IPL match & ball-by-ball dataset (2008–2023)
Dataset & model details
- Dataset: Kaggle IPL match & ball-by-ball dataset, seasons 2008–2023 — matches.csv with 1,000+ matches (columns include season, venue, team1, team2, toss_winner, toss_decision, winner, result_margin, target_runs) and deliveries.csv with 250,000+ deliveries (columns include inning, batting_team, bowling_team, over, total_runs, is_wicket). Public open dataset.
- Task: Binary classification — given a match state (pre-match or in-play), predict whether the batting/chasing side wins. Input = engineered feature vector (venue, toss winner/decision, dataset team-strength index, current score, overs elapsed, wickets lost, required run rate); output = win probability per side (mean vote across trees).
- Model: Random Forest classifier (design: 200 trees, tuned max depth and minimum samples per leaf). Training rows are built per match state from both tables; team-strength features are computed from the training seasons only to avoid leakage; evaluation uses a season-based holdout (later seasons unseen).
- Metrics: Held-out accuracy (design target ≈62–66%, stated as a target — the report documents the actually achieved figure after the training run), precision/recall, ROC-AUC, feature importances and a calibration plot. No accuracy is claimed as measured until the training run is executed for the order.
Delivery information
Built-to-order project. Delivery timeline is shared after order confirmation based on current queue.
Support terms
Complete documentation, setup guide, and viva preparation included. Support for setup and explanation provided.
Download free synopsis (PDF)
Enter your name and email — the synopsis PDF downloads immediately. We may send occasional project updates; no spam, unsubscribe anytime.