
More project photos (2)
The problem
Every retailer knows customers are not all alike, but few can say precisely how their shoppers group — who spends freely, who buys carefully, who needs a nudge. Customer segmentation turns that intuition into data: group customers by behaviour so marketing, inventory and loyalty programs can target each group differently. The Mall Customers dataset is the classic teaching ground for this — 200 shoppers described by age, annual income and a spending score — and K-Means is the canonical first clustering algorithm. This project does it properly: standardized features, k-means++ initialization, the elbow method to justify k=5, silhouette-score validation, and five named, interpretable segments with business profiles. The interactive demo makes the abstract concrete — explore the segment map and find your own segment.
How it works
- The 200-row Mall Customers dataset is loaded and inspected; Annual Income and Spending Score are selected as the clustering features.
- Features are standardized (zero mean, unit variance) so income scale does not dominate the distance metric.
- K-Means is run for k=1..10 with k-means++ initialization; the elbow in the WCSS curve justifies k=5.
- The final model is fitted with k=5; the silhouette score is computed to quantify cluster separation.
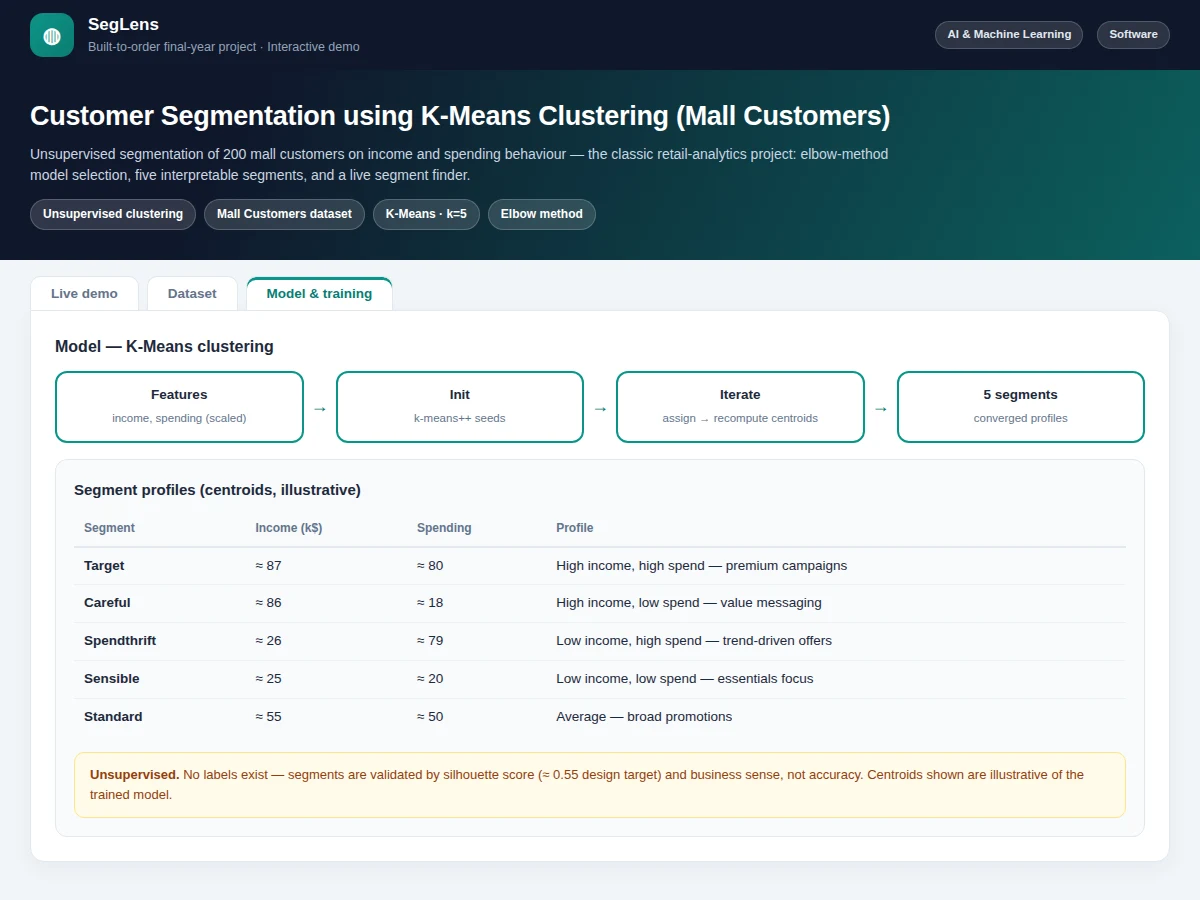
- Each cluster's centroid is translated into a business profile (Target, Careful, Spendthrift, Sensible, Standard) with a recommended marketing action.
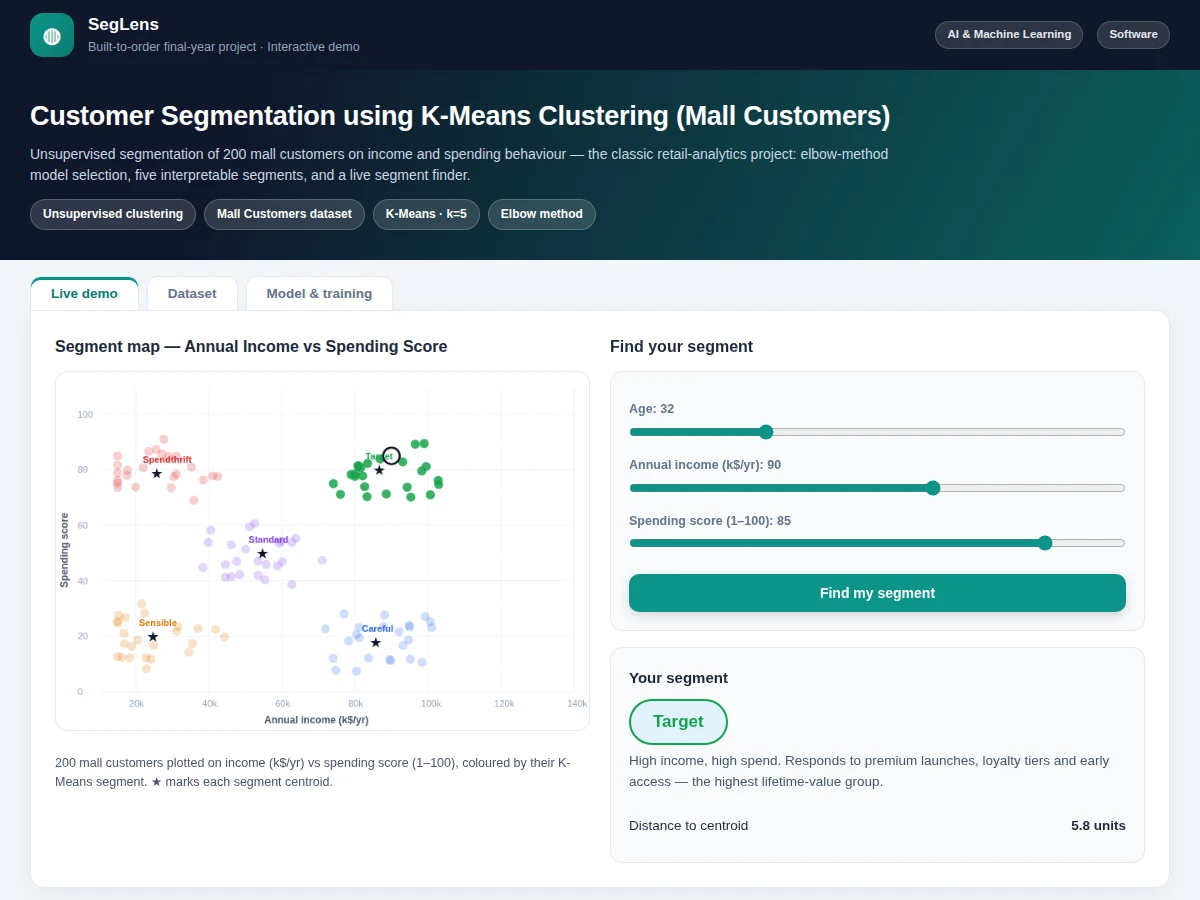
- In the web demo, the segment map renders all 200 customers coloured by cluster; the segment finder standardizes your inputs with the saved scaler and assigns the nearest centroid.
Tech stack:
- Python 3, scikit-learn (KMeans, metrics)
- Pandas, NumPy (data handling)
- Matplotlib (elbow plot, segment map)
- Jupyter Notebook (analysis & evaluation)
- HTML5 + JavaScript (interactive segment demo)
- Mall Customers dataset (200 records)
Dataset & model details
- Dataset: Mall Customers — 200 records with CustomerID, Gender, Age, Annual Income (k$/yr) and Spending Score (1–100). A standard public teaching dataset for clustering.
- Task: Unsupervised clustering; input = (annual income, spending score) standardized, output = segment assignment among 5 clusters.
- Model: K-Means with k=5 (elbow method), k-means++ initialization, 300 max iterations, features standardized with StandardScaler. Segment names and business profiles derived from centroid positions.
- Metrics: Silhouette score ≈ 0.55 (design target for the built-to-order run) and WCSS elbow analysis. Unsupervised learning has no accuracy — the project states this explicitly and validates with silhouette score plus business sense.
| Parameter | Value |
|---|---|
| Records | 200 customers, 5 features |
| Clustering features | Annual Income (k$/yr), Spending Score (1–100), standardized |
| Algorithm | K-Means, k=5 (elbow method), k-means++ init |
| Silhouette score | ≈ 0.55 (design target, not a measured claim) |
| Segments | 5 named profiles: Target, Careful, Spendthrift, Sensible, Standard |
| Notebook runtime | Under 2 minutes on any laptop (expected) |
| Demo | Single-file web app, runs offline after download |
Project features
- [Elbow-method model selection] Within-cluster sum of squares plotted for k=1..10 with the elbow at k=5 — the standard, defensible way to choose the number of segments, not a guess.
- [Interactive segment map] All 200 customers plotted on income vs spending score, coloured by segment with centroids marked — hover-free, clean and presentation-ready.
- [Live segment finder] Enter age, annual income and spending score on sliders and get your segment instantly, with the distance to the centroid and a plain-English business profile.
- [Five interpretable segments] Target, Careful, Spendthrift, Sensible and Standard — each with a centroid profile and a marketing action (premium campaigns, value messaging, trend-driven offers...).
- [Silhouette validation] Silhouette score (≈ 0.55 design target) reported alongside the elbow analysis, so the clustering quality is quantified, not asserted.
- [Full analysis notebook] Data loading, scaling, K-Means fitting, elbow and silhouette analysis, segment profiling and visualization in one reproducible Jupyter notebook.
- [Segment profile cards] Per-segment income/spending centroids with business interpretation — ready to drop into the report and PPT.
- [Exported cluster model] Fitted scaler + K-Means centroids saved, so the demo assigns segments with the real model without refitting.
What is included
- Complete analysis Jupyter notebook (elbow, silhouette, profiling)
- Fitted scaler + K-Means model files
- Interactive segment-map web demo with live segment finder
- Elbow plot, silhouette analysis and segment-map figures
- Project report PDF (background, K-Means theory, methodology, segment profiles, business actions)
- PPT presentation for final review
- Viva Q&A preparation document (K-Means, elbow vs silhouette, standardization, unsupervised validation)
Limitations & prerequisites
- Unsupervised learning has no ground-truth labels — segments are validated by silhouette score and business sense, never by accuracy.
- 200 records is a teaching-scale dataset; real retail segmentation uses far larger, richer customer data.
- Segment names (Target, Careful, ...) are interpretive labels on the clusters, not predictions about real people.
- The demo assigns segments with the fitted model; it does not retrain or discover new segments live.
- All metric figures are design targets for the analysis run, stated honestly — the report documents the actual achieved figures.
Frequently Asked Questions
Why K-Means for this problem?
Customer segmentation is a natural clustering task: no labels exist, and the business question is 'what groups exist in the data'. K-Means is the canonical first algorithm — simple, fast, interpretable centroids — and the elbow method gives a principled way to choose k.
How is k=5 chosen?
By the elbow method: K-Means is run for k=1..10, the within-cluster sum of squares is plotted, and k=5 sits at the elbow where adding more clusters stops paying off. The notebook shows the full curve.
What does the silhouette score mean?
It measures how similar each customer is to its own cluster versus the nearest other cluster, from -1 to +1. Around 0.55 indicates reasonably separated, meaningful segments — reported as a design target for the built-to-order run.
Can segments be used for real marketing?
As a teaching demonstration of the method, yes in principle — each segment gets a business profile with a suggested action. Real deployments would need far more data and A/B testing, which the report lists as future scope.
What does the report cover?
Segmentation background, the Mall Customers dataset, K-Means theory, the elbow and silhouette analysis, the five segment profiles with business actions, limitations of unsupervised evaluation, and future scope.
Is this project suitable for a final-year project?
Yes — for Computer Science, IT and AI/ML programs. It is the classic unsupervised-learning project done rigorously: model selection, validation without labels, interpretable results and a working interactive demo. Suitable for B.E./B.Tech final-year projects in Computer Science, IT and AI & Machine Learning.
Components & software requirements
- Python 3, scikit-learn (KMeans, metrics)
- Pandas, NumPy (data handling)
- Matplotlib (elbow plot, segment map)
- Jupyter Notebook (analysis & evaluation)
- HTML5 + JavaScript (interactive segment demo)
- Mall Customers dataset (200 records)
Dataset & model details
- Dataset: Mall Customers — 200 records with CustomerID, Gender, Age, Annual Income (k$/yr) and Spending Score (1–100). A standard public teaching dataset for clustering.
- Task: Unsupervised clustering; input = (annual income, spending score) standardized, output = segment assignment among 5 clusters.
- Model: K-Means with k=5 (elbow method), k-means++ initialization, 300 max iterations, features standardized with StandardScaler. Segment names and business profiles derived from centroid positions.
- Metrics: Silhouette score ≈ 0.55 (design target for the built-to-order run) and WCSS elbow analysis. Unsupervised learning has no accuracy — the project states this explicitly and validates with silhouette score plus business sense.
Delivery information
Built-to-order project. Delivery timeline is shared after order confirmation based on current queue.
Support terms
Complete documentation, setup guide, and viva preparation included. Support for setup and explanation provided.