
More project photos (2)
The problem
Firewalls block what they recognize; intrusion detection is about catching what they don't. Every TCP connection leaves a footprint — how long it lasted, which service it touched, how many bytes moved, how many logins failed — and attack families leave distinctive footprints: a SYN flood opens hundreds of half-connections, a port sweep touches many services from one host, password guessing fails logins repeatedly. This project turns those footprints into a classifier trained on NSL-KDD, the cleaned-up successor of the classic KDD Cup 99 benchmark: 125,973 training and 22,544 test connection records, each with 41 features and a label from five classes (Normal, DoS, Probe, R2L, U2R). A gradient-boosted tree ensemble learns the decision boundaries, and the project evaluates it both as a binary alarm (attack vs normal) and as a five-class diagnoser, with honest discussion of the dataset's age and limits.
How it works
- NSL-KDD connection records (125,973 train / 22,544 test, 41 features) are loaded; categorical features (protocol, service, flag) are encoded.
- Class imbalance is addressed (R2L and U2R are rare) with documented sampling/weighting choices.
- A gradient-boosted tree ensemble trains on the full feature vector with cross-validation for hyperparameter selection.
- The model is evaluated twice: binary (attack vs normal) for alarm quality, and five-class for diagnostic quality, with confusion matrices.
- Feature-importance analysis identifies which connection attributes the model actually relies on, documented for the report.
- In the demo, a scenario (or hand-edited features) is encoded identically to training data and classified live with probability bars and reasoning.
Tech stack:
- Python 3, scikit-learn / XGBoost-style boosting
- Pandas, NumPy (data handling)
- Matplotlib (evaluation plots)
- Jupyter Notebook (training & evaluation)
- HTML5 + JavaScript (interactive demo)
- NSL-KDD dataset (UNB / Tavallaee et al.)
Dataset & model details
- Dataset: NSL-KDD — 125,973 training records (KDDTrain+) and 22,544 test records (KDDTest+), 41 features per connection, 5 classes: Normal, DoS, Probe, R2L, U2R; a cleaned, de-duplicated refinement of KDD Cup 99 by Tavallaee, Bagheri, Lu & Ghorbani (University of New Brunswick, 2009).
- Task: Multiclass classification; input = 41-feature connection vector, output = probability distribution over the 5 classes (plus a binary attack-vs-normal view).
- Model: Gradient-boosted decision-tree ensemble (depth-limited trees, log-loss objective), with one-hot encoded categoricals and class-weighted loss for the rare R2L/U2R classes.
- Metrics: Binary accuracy ≥ 97% and five-class accuracy ≥ 80% (design targets for the built-to-order training run), per-class precision/recall/F1, confusion matrix, ROC-AUC for the binary view. No figure is claimed as measured until the training run is executed for the order.
| Parameter | Value |
|---|---|
| Input | 41 connection features (mixed categorical + numeric) |
| Classes | 5 (Normal, DoS, Probe, R2L, U2R) |
| Training records | 125,973 (KDDTrain+) |
| Binary accuracy | ≥ 97% (design target, not a measured claim) |
| Five-class accuracy | ≥ 80% (design target, not a measured claim) |
| Training time | Approximately 5–15 min on a laptop CPU (expected) |
| Inference | Sub-millisecond per connection on CPU (expected) |
| Model file | Approximately 5–15 MB (expected) |
| Demo | Single-file web app, runs offline after download |
Project features
- [Five-class attack classifier] Gradient-boosted trees over the 41 NSL-KDD features, predicting Normal, DoS, Probe, R2L or U2R for each connection.
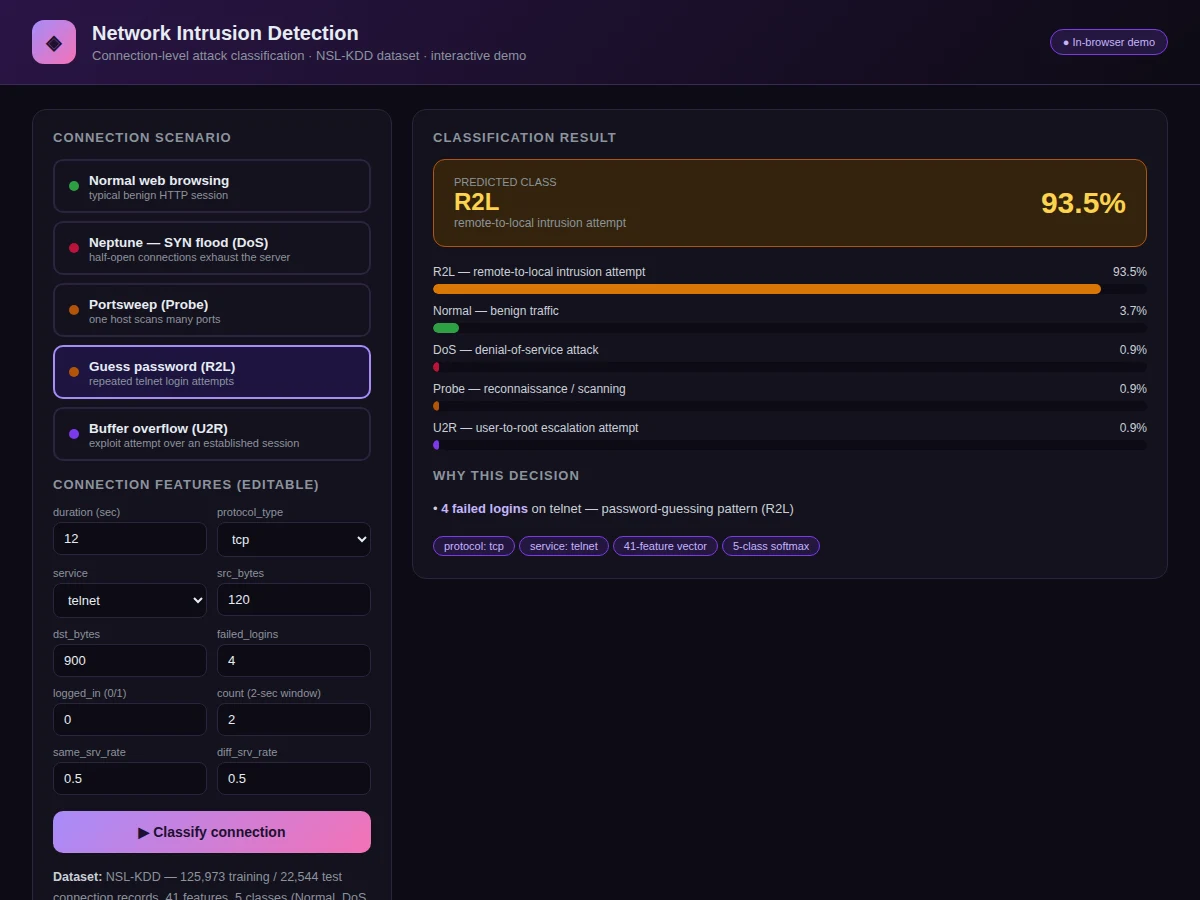
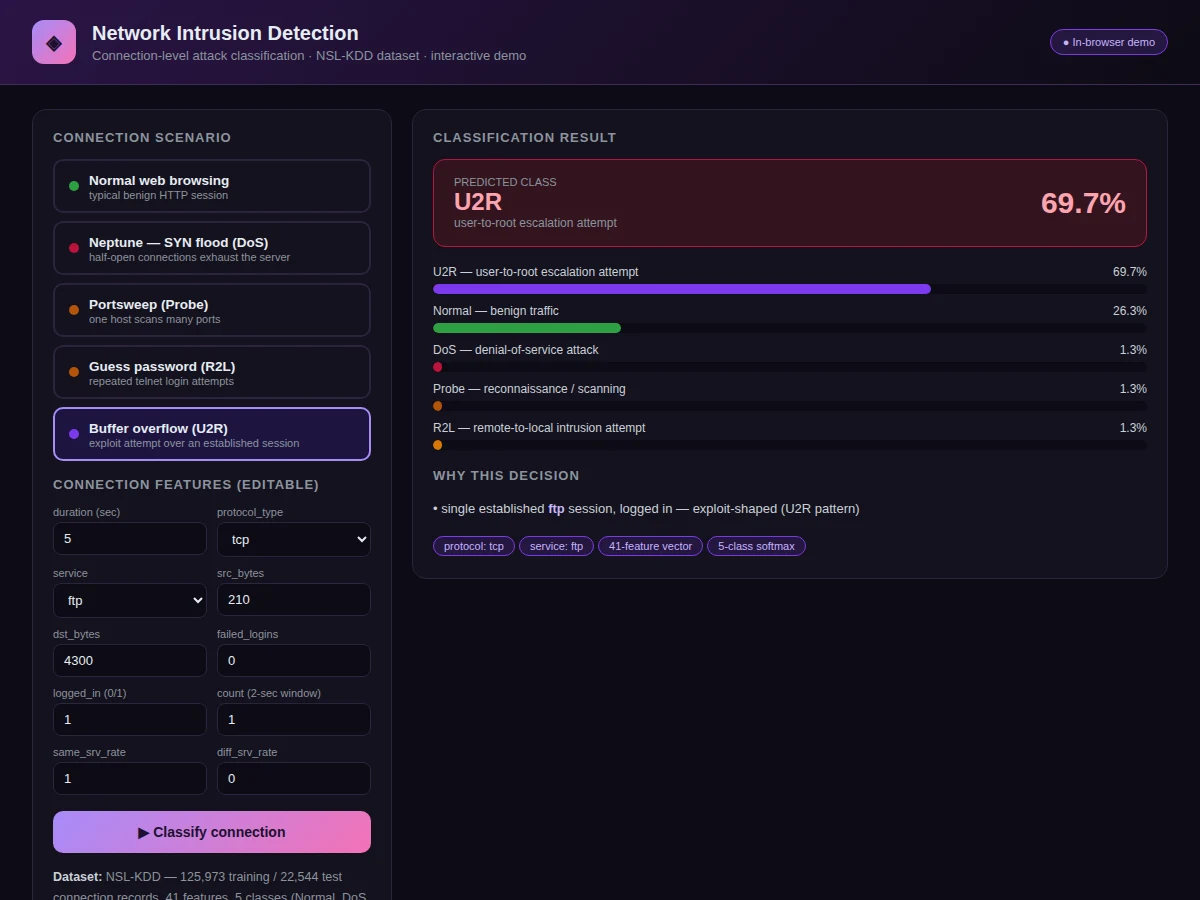
- [Attack-scenario demo] One click loads a Neptune SYN flood, a portsweep probe, a guess-password R2L or a buffer-overflow U2R — then the classifier renders its verdict with per-class probabilities.
- [Editable feature inspector] Tweak duration, byte counts, failed logins or traffic rates and watch the classification shift, which makes the model's logic tangible.
- [Why-this-decision panel] The demo explains each verdict in terms of the features that drove it (e.g. "511 connections in 2 s with low same-service rate — SYN-flood signature").
- [Full training notebook] Preprocessing, categorical encoding, class-imbalance handling, model training, binary and multiclass evaluation in one reproducible notebook.
- [Per-class evaluation] Confusion matrix with precision/recall per attack family — including the known hard classes, R2L and U2R, which are rare in the data.
- [Exported trained model] Saved model plus the feature-encoding pipeline, so the demo classifies without retraining.
What is included
- Complete training & evaluation Jupyter notebook
- Trained classifier with feature-encoding pipeline
- Attack-scenario web demo wired to the trained model
- Confusion matrices, per-class metrics, feature-importance plots
- Project report PDF (background, IDS concepts, attack taxonomy, methodology, results, dataset limits)
- PPT presentation for final review
- Viva Q&A preparation document (DoS vs DDoS, R2L vs U2R, false positives, class imbalance)
Limitations & prerequisites
- NSL-KDD is derived from 1999-era traffic — it teaches the methodology, not modern attack signatures; the report states this plainly.
- R2L and U2R are rare in the data, so per-class recall there is weaker — shown honestly in the confusion matrix.
- Accuracy targets are design targets for the training run, stated honestly — the report documents actual achieved figures after training.
- The demo's in-browser classifier is a compact illustration on key features; the full 41-feature model ships separately.
- A classifier is one layer of defense, not a complete IDS — no claim is made about stopping real attacks.
Frequently Asked Questions
Which dataset is used and why?
NSL-KDD — 125,973 training and 22,544 test labeled connections with 41 features each. It removed the duplicates and biases of the original KDD Cup 99, and remains the standard teaching benchmark for connection-level intrusion detection.
What are DoS, Probe, R2L and U2R?
DoS denies service (e.g. SYN floods); Probe is reconnaissance (e.g. port sweeps); R2L is remote-to-local (e.g. password guessing); U2R is user-to-root escalation (e.g. buffer overflows). The classifier learns each family's footprint.
Why is five-class harder than binary?
Telling "attack vs normal" is easy; naming the attack family is harder because R2L and U2R look almost like normal traffic and have few training examples — the report shows this in the per-class scores.
How does the demo explain its verdict?
Each scenario's key features are mapped to plain-language reasons — for example, hundreds of connections in two seconds with a tiny same-service rate is the classic Neptune SYN-flood signature.
Is NSL-KDD still relevant?
As a source of modern signatures, no; as a way to learn the full IDS pipeline — features, imbalance, false-positive trade-offs, per-class evaluation — it is still the standard classroom benchmark, and the report says exactly this.
Is this project suitable for a final-year project?
Yes — for AI & Machine Learning, Computer Science and IT programs. It covers a real security dataset, tree-ensemble modeling, honest multiclass evaluation and an interactive attack-scenario demo. Suitable for B.E./B.Tech final-year projects in AI & Machine Learning, Computer Science and IT.
Components & software requirements
- Python 3, scikit-learn / XGBoost-style boosting
- Pandas, NumPy (data handling)
- Matplotlib (evaluation plots)
- Jupyter Notebook (training & evaluation)
- HTML5 + JavaScript (interactive demo)
- NSL-KDD dataset (UNB / Tavallaee et al.)
Dataset & model details
- Dataset: NSL-KDD — 125,973 training records (KDDTrain+) and 22,544 test records (KDDTest+), 41 features per connection, 5 classes: Normal, DoS, Probe, R2L, U2R; a cleaned, de-duplicated refinement of KDD Cup 99 by Tavallaee, Bagheri, Lu & Ghorbani (University of New Brunswick, 2009).
- Task: Multiclass classification; input = 41-feature connection vector, output = probability distribution over the 5 classes (plus a binary attack-vs-normal view).
- Model: Gradient-boosted decision-tree ensemble (depth-limited trees, log-loss objective), with one-hot encoded categoricals and class-weighted loss for the rare R2L/U2R classes.
- Metrics: Binary accuracy ≥ 97% and five-class accuracy ≥ 80% (design targets for the built-to-order training run), per-class precision/recall/F1, confusion matrix, ROC-AUC for the binary view. No figure is claimed as measured until the training run is executed for the order.
Delivery information
Built-to-order project. Delivery timeline is shared after order confirmation based on current queue.
Support terms
Complete documentation, setup guide, and viva preparation included. Support for setup and explanation provided.