
More project photos (5)

The problem
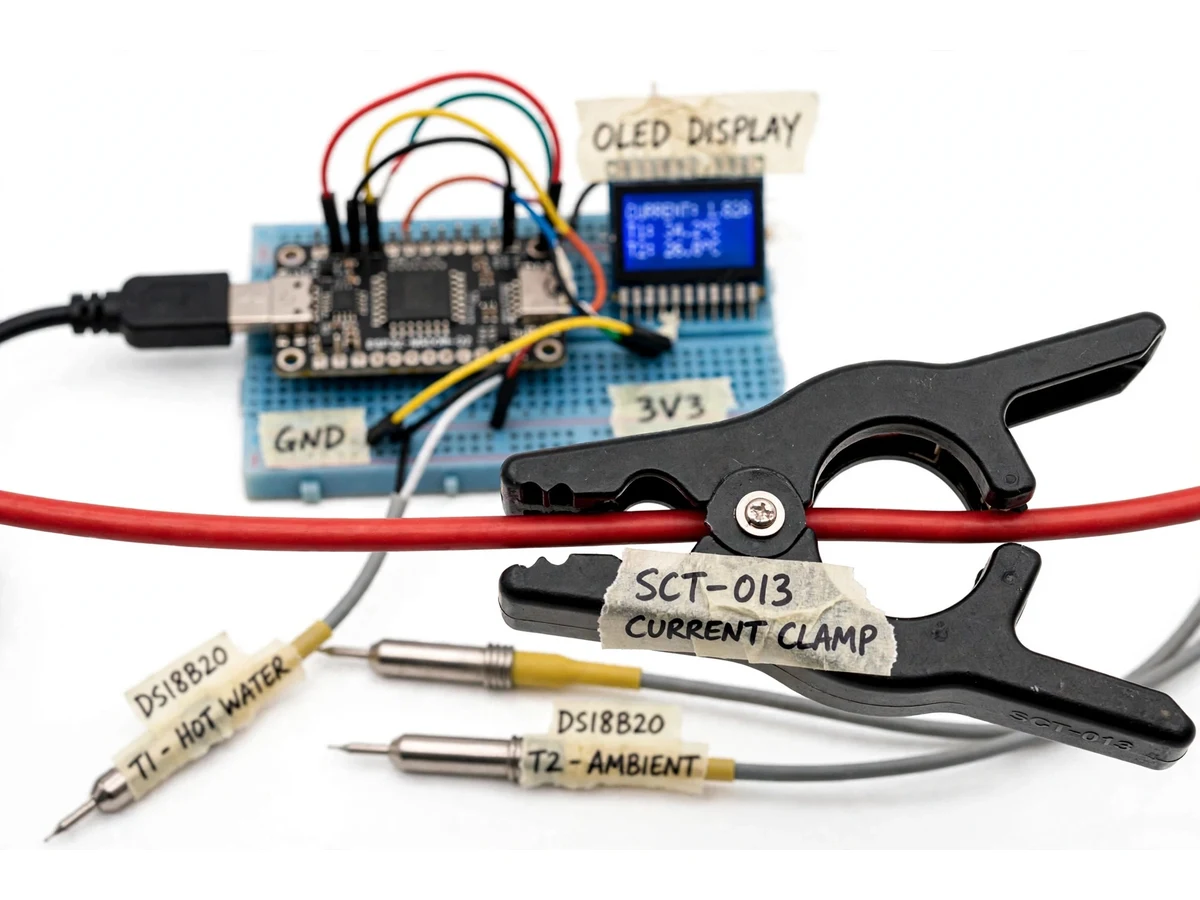
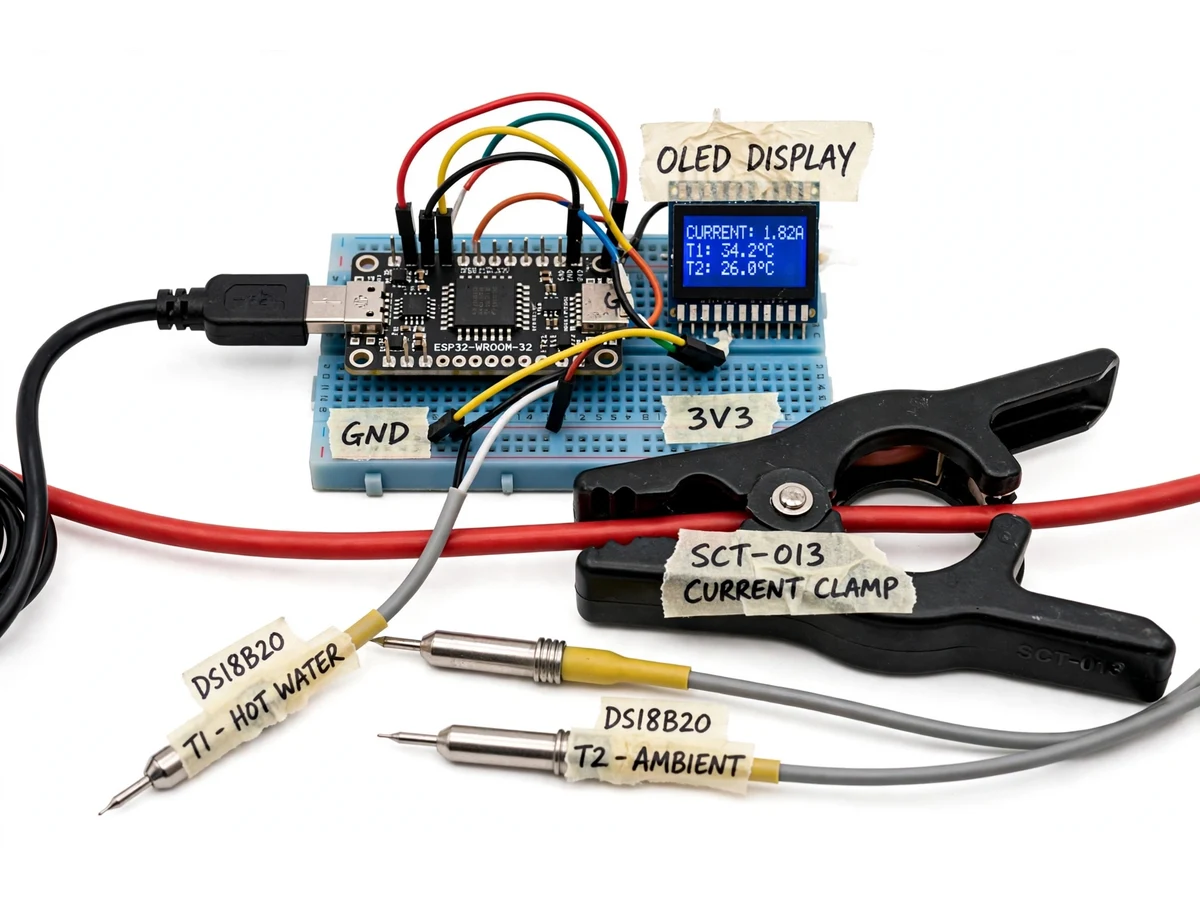
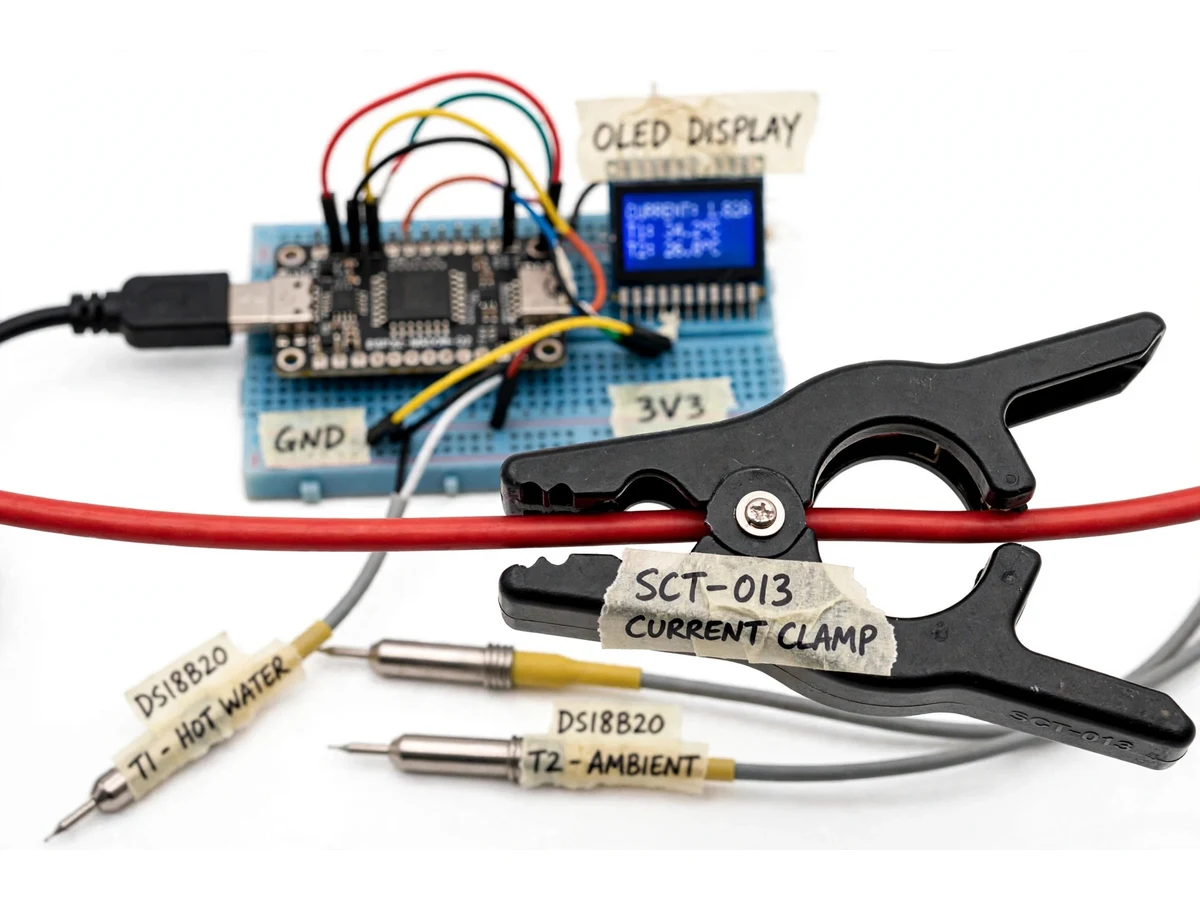
A water cooler is a small refrigeration machine that everyone depends on and nobody monitors. When its performance degrades — low refrigerant, a dusty condenser, a tired compressor — the first symptom is water that is merely cool instead of cold, and the second is a compressor that runs far longer than it should, wasting energy. Facility staff learn about it only through complaints. This project instruments the cooler: a split-core current transformer clamped around the compressor supply measures current draw without touching mains wiring, and DS18B20 sensors track outlet water and ambient temperature. An ESP32 publishes these readings over Wi-Fi to a cloud dashboard every minute, and the firmware plus dashboard analytics turn raw data into health insight: pull-down time after a hot-water draw, compressor duty cycle, short-cycling events, and run-hour accumulation toward the next service. Because it is a hybrid build, the student delivers both the sensing hardware and a genuinely working dashboard — the demo app in this package shows exactly what the facility manager sees.
How it works
- A split-core CT clamp is clipped around the compressor's supply wire and DS18B20 sensors are strapped to the outlet pipe and placed for ambient reading — no mains wiring is disturbed.
- The ESP32 samples compressor current and both temperatures, computes RMS current, and determines compressor state (running/idle) from the current signature.
- Every minute the node publishes temperature, current, state and cumulative run-hours over Wi-Fi (MQTT/HTTP) to the cloud dashboard backend.
- Firmware-side analytics detect short-cycling (more than N starts per hour) and abnormal current bands, raising local and dashboard alerts immediately.
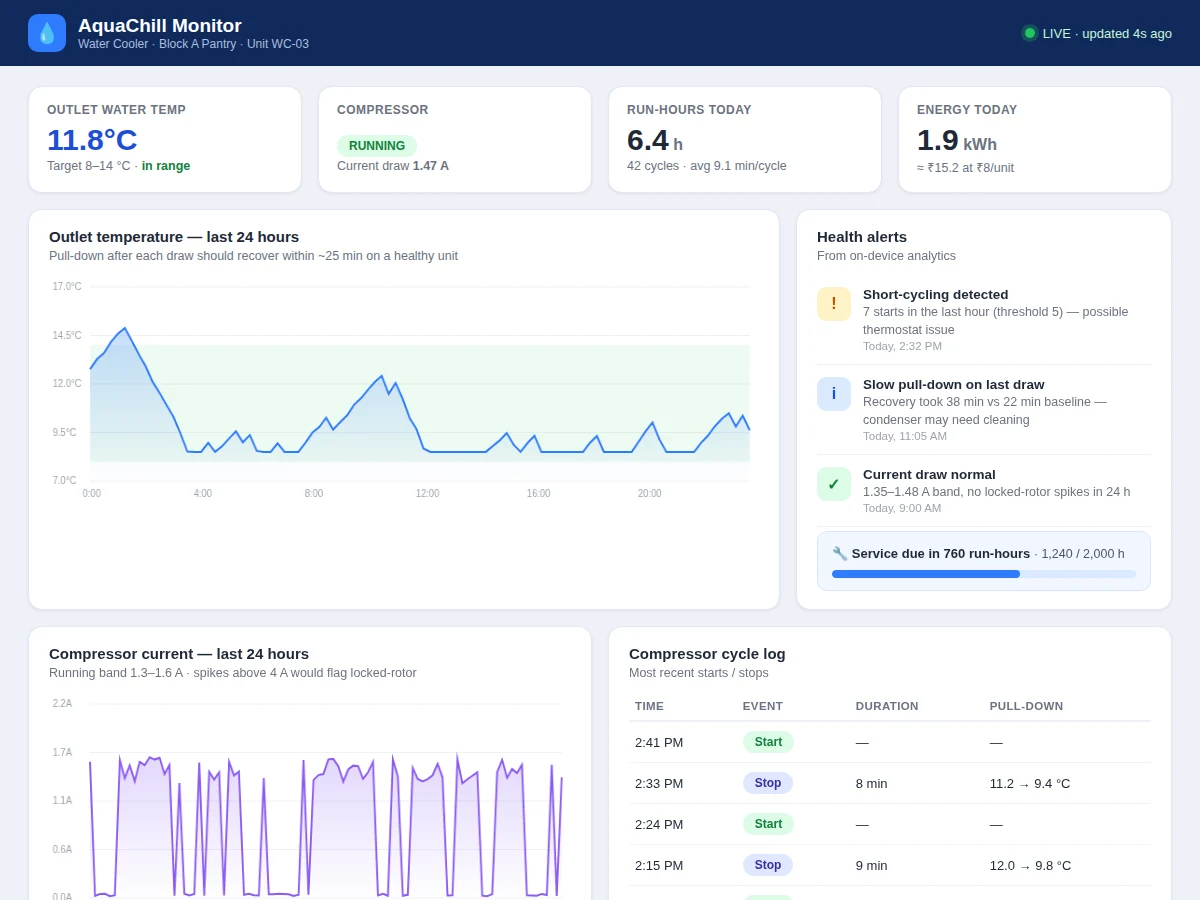
- The dashboard renders live gauges, the 24-hour temperature and current charts, the cycle-event log and the run-hour progress toward the service interval.
- The student commissions the unit with the included procedure: baseline a healthy cooler for a day, set the alert thresholds from the observed data, and document the healthy signature in the report.
Tech stack:
- ESP32 (sensing + Wi-Fi telemetry)
- SCT-013 split-core current transformer
- DS18B20 waterproof temperature sensors
- MQTT/HTTP cloud telemetry
- Web dashboard (HTML/CSS/JS demo included)
- Arduino IDE (C/C++ firmware)
- 5 V USB power for the node
| Parameter | Value |
|---|---|
| Current sensing | SCT-013 CT clamp, non-invasive (datasheet) |
| Temperature sensing | DS18B20, ±0.5 °C (datasheet) |
| Telemetry interval | 1 minute (configurable) |
| Compressor state | Derived from current signature (design) |
| Alerts | Short-cycling, abnormal current, warm-water (design) |
| Dashboard | Live gauges, 24-h charts, event log, run-hour counter |
| Power | 5 V USB adapter |
| Installation | No mains wiring disturbed |
Project features
- [Non-invasive compressor monitoring] A split-core CT clamp measures compressor current without cutting or stripping any mains wire — safe to install and honest to demonstrate.
- [Live cloud dashboard] Outlet temperature, compressor current, run state and cumulative run-hours stream to the dashboard every minute with historical charts.
- [Cooling performance tracking] The dashboard charts temperature pull-down after draws, so a degrading unit shows up as slower cooling long before users complain.
- [Short-cycling detection] Firmware flags rapid on/off compressor cycling — the classic symptom of thermostat or refrigerant trouble — and raises a dashboard alert.
- [Abnormal current alerts] Current draw outside the learned normal band (locked-rotor-like spikes, or suspiciously low draw) triggers maintenance alerts with timestamps.
- [Run-hour maintenance counter] Accumulated compressor hours count toward a configurable service interval, turning "service it sometime" into a scheduled task.
- [Working demo dashboard] A single-file web dashboard with realistic simulated telemetry is included, so the student can present the full system even before hardware is installed.
What is included
- Assembled sensor node (ESP32 + CT interface + temperature sensors)
- Split-core CT clamp and waterproof DS18B20 probes
- Firmware source with current-signature analytics
- Working single-file dashboard demo with simulated telemetry
- Installation and commissioning guide (non-invasive fitting)
- Project report PDF (theory, sensing, analytics, dashboard, results)
- PPT presentation and viva Q&A document
Limitations & prerequisites
- The CT clamp measures current only; it cannot directly diagnose refrigerant charge or compressor mechanical wear — it infers health from electrical and thermal signatures, stated honestly.
- Alert thresholds must be learned from each cooler's own baseline; a unit that is already faulty at commissioning will teach the system the wrong "normal".
- The dashboard demo ships with simulated telemetry; live data appears only after the hardware node is installed and connected.
- Wi-Fi coverage is required at the cooler location; the node buffers briefly but is not a long-term offline logger.
- Temperature sensors strapped to pipes read approximately, not the exact internal water temperature.
- One node monitors one cooler; a building-wide deployment needs one node per unit.
Frequently Asked Questions
Is it safe to install on a real water cooler?
Yes — the CT clamp clips around the insulated supply wire without cutting it, and temperature probes strap to the outside of pipes. No mains conductors are exposed or disturbed; the guide documents the safe fitting procedure.
What does "health" actually mean here?
Cooling performance (how fast water temperature recovers), compressor electrical behavior (current draw, cycling pattern) and accumulated run-hours — the three signals a technician would check, made continuous.
How does short-cycling detection work?
The firmware counts compressor starts per hour from the current signature. More than the configured threshold (set during commissioning) indicates the thermostat or refrigerant needs attention, and the dashboard logs each event.
Does the dashboard work without hardware?
The included single-file demo dashboard runs on simulated telemetry for presentation and viva purposes; connecting the real node replaces the simulator with live data through the same interface.
Can one dashboard watch many coolers?
The architecture supports one node per cooler reporting to the same backend; the demo shows a single unit and the report documents how the multi-unit extension works.
Is this project suitable for a final-year project?
Yes — for IoT & Embedded, Electronics and Electrical programs. It combines non-invasive sensing, embedded analytics, cloud telemetry and a real dashboard. Suitable for B.E./B.Tech final-year projects in IoT & Embedded, Electronics / E&TC and Electrical.
Components & software requirements
- ESP32 (sensing + Wi-Fi telemetry)
- SCT-013 split-core current transformer
- DS18B20 waterproof temperature sensors
- MQTT/HTTP cloud telemetry
- Web dashboard (HTML/CSS/JS demo included)
- Arduino IDE (C/C++ firmware)
- 5 V USB power for the node
Delivery information
Built-to-order project. Delivery timeline is shared after order confirmation based on current queue.
Support terms
Complete documentation, setup guide, and viva preparation included. Support for setup and explanation provided.