
More project photos (3)
The problem
Rotating machines rarely fail without warning — they warn in vibration first. Rising unbalance, developing misalignment and spalling bearings each leave a characteristic fingerprint in the vibration spectrum, but most small plants have no one reading spectra and learn about the fault when the machine stops. Professional analyzers are expensive and need trained analysts. This project puts the core of vibration analysis on student hardware: a MEMS accelerometer on the bearing housing, edge-computed FFT spectra, severity judged against the ISO 10816 standard, and a dashboard that marks the classic fault frequencies for the user. It teaches the signal chain from acceleration to diagnosis honestly, including what a low-cost MEMS sensor can and cannot resolve.
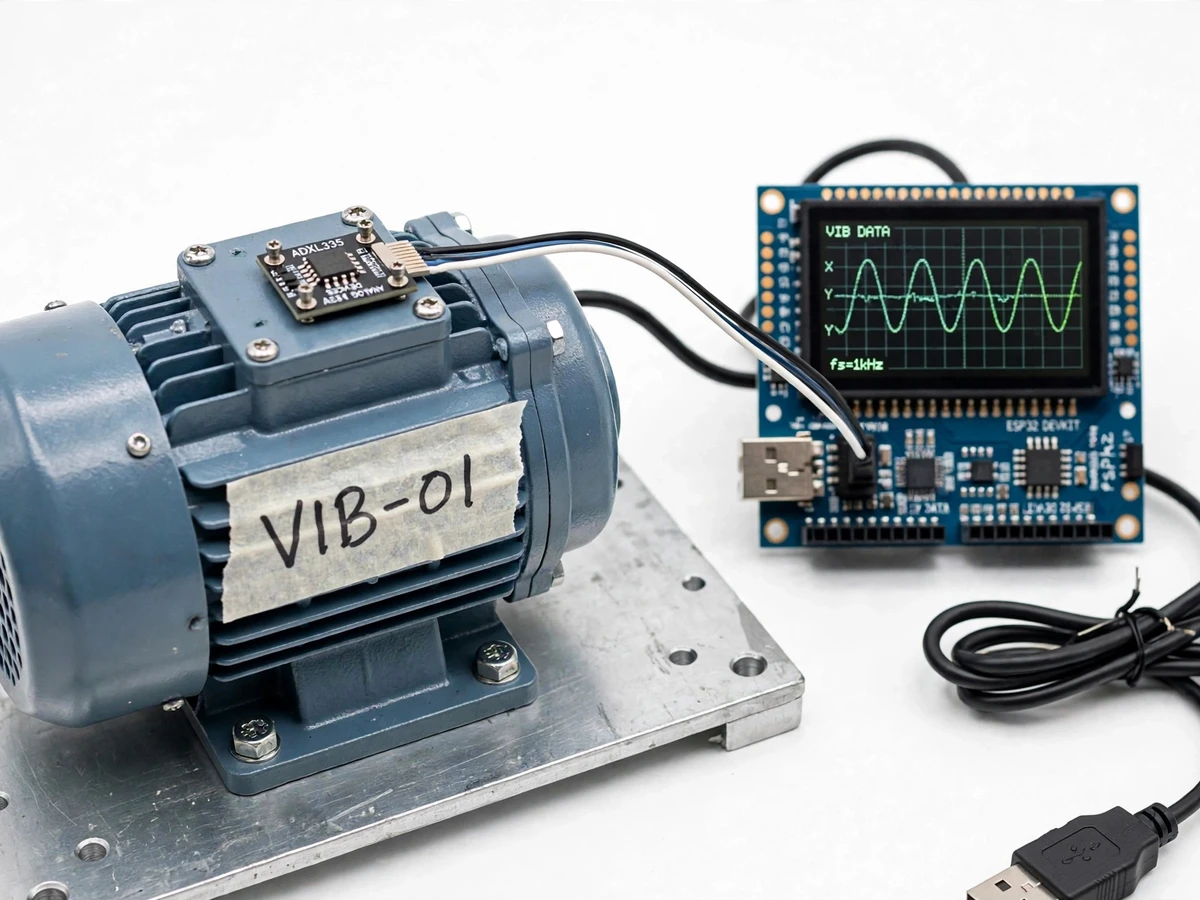
MEMS accelerometer stud-mounted on the drive-end bearing housing of the demo motor.
Follow the working sequence
How it works
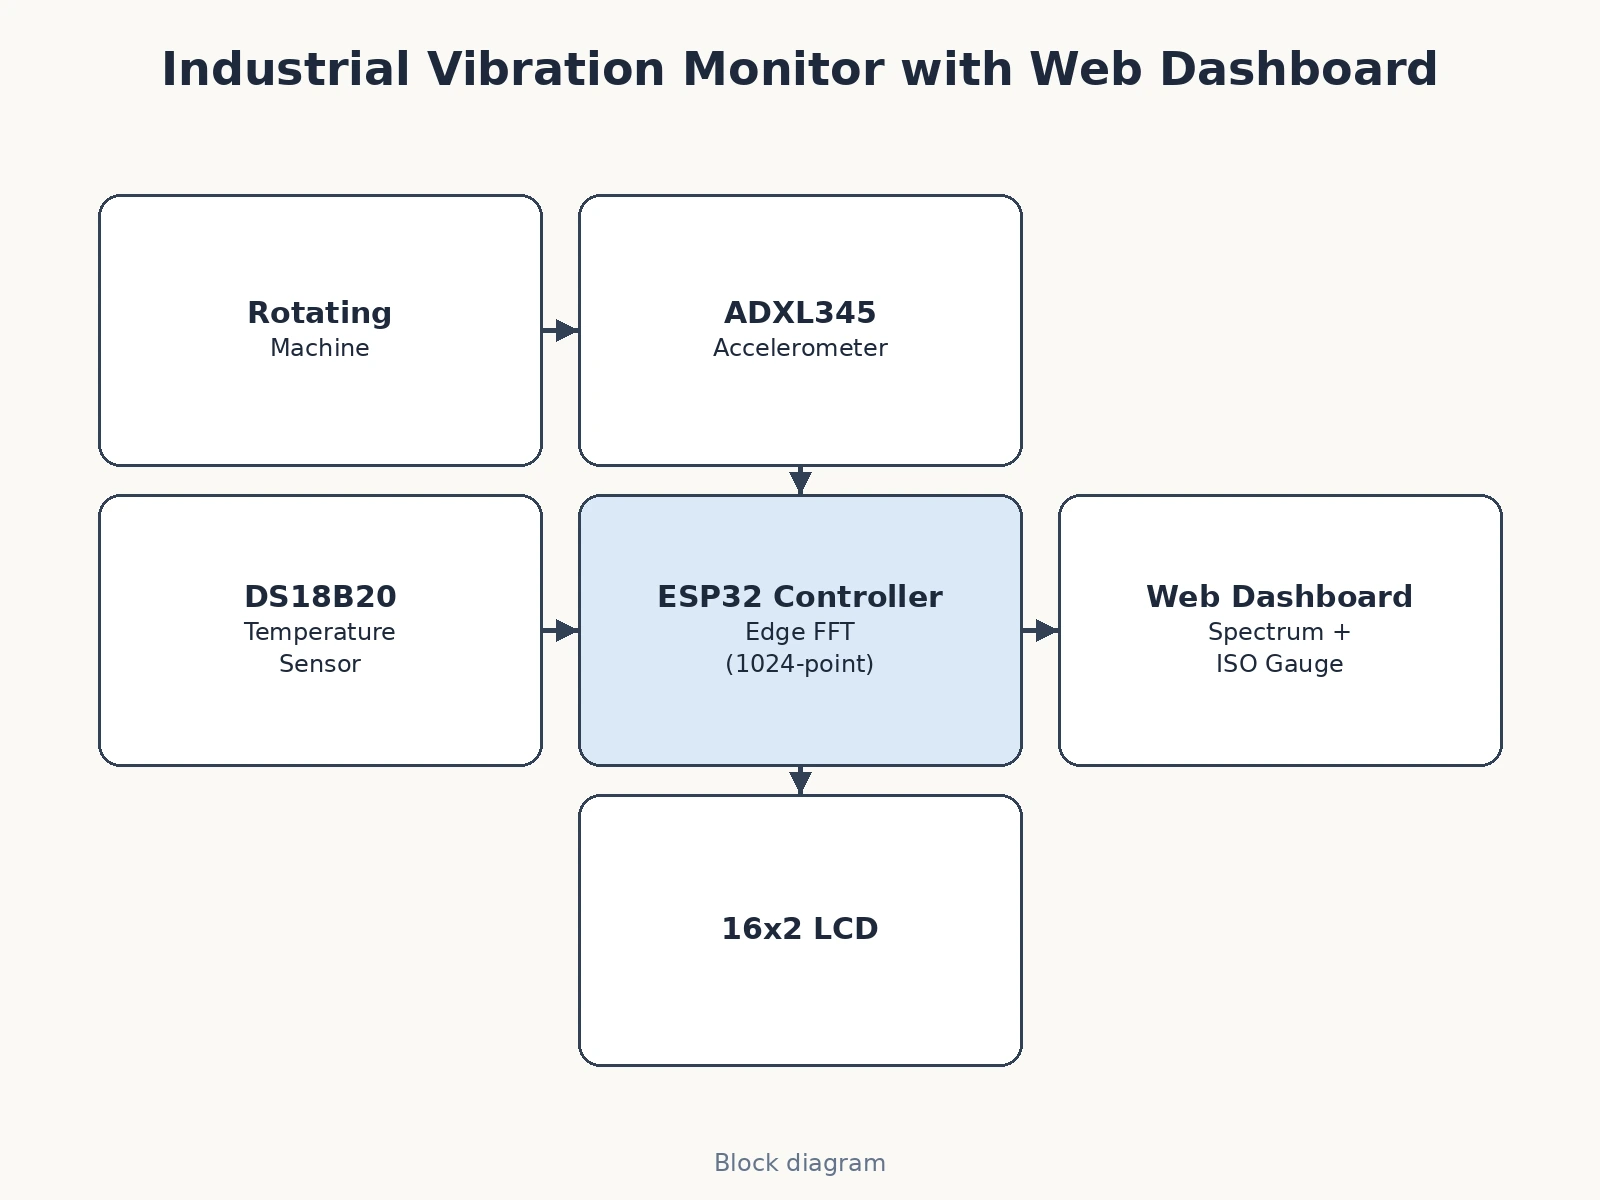
- The MEMS accelerometer is stud-mounted (or magnet-mounted in the demo) on the drive-end bearing housing of the demo motor.
- The ESP32 samples all three axes at 1.6 kHz in fixed blocks and applies a Hanning window to each block.
- A 1024-point FFT converts each block to a velocity spectrum; the firmware extracts overall RMS velocity and the amplitudes at 1X, 2X and the configured BPFI.
- The overall velocity is compared with the ISO 10816 zone limits for the machine group; zone entry raises the corresponding alarm level.
- The DS18B20 bearing-temperature reading is sampled alongside and checked against its limit with a rising-trend watch.
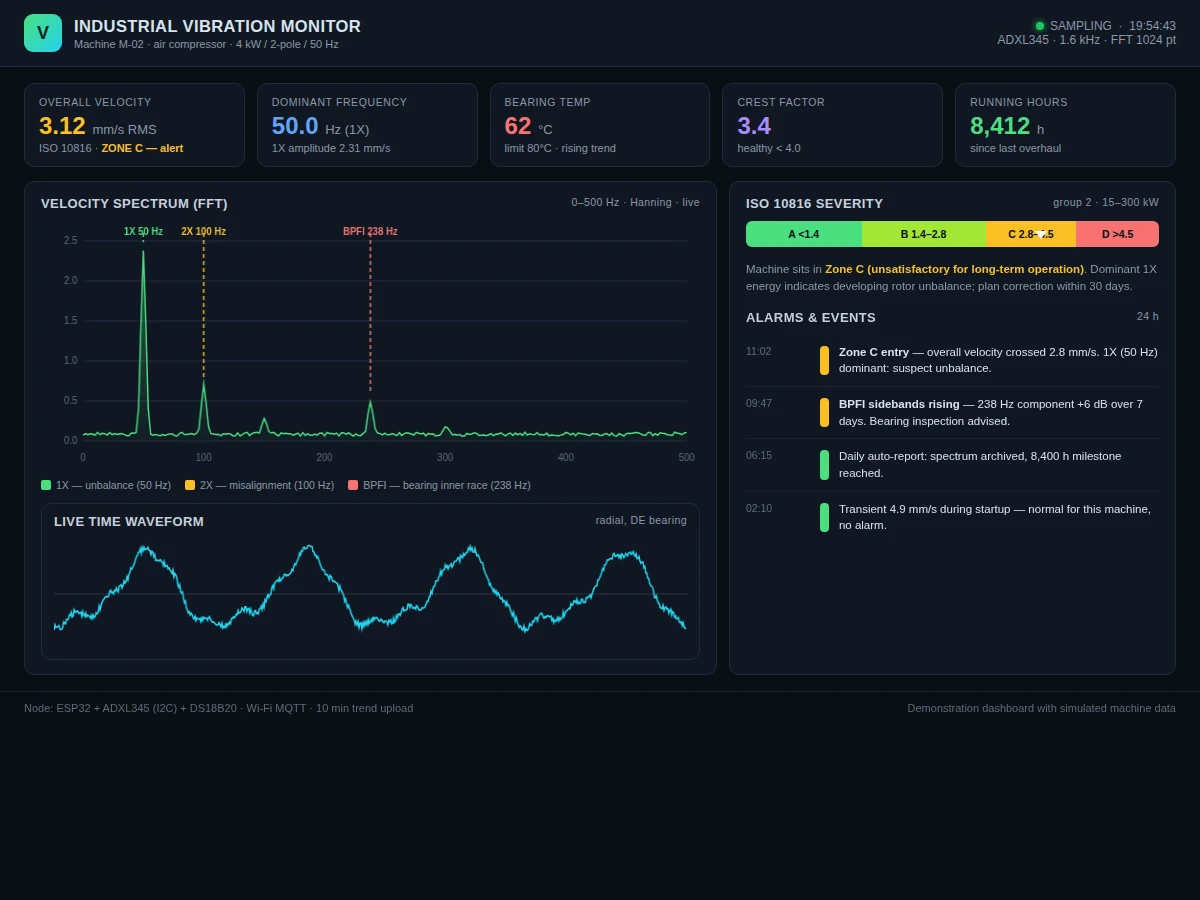
- Every 10 minutes a compact summary (overall velocity, zone, key amplitudes, temperature) publishes over MQTT; the dashboard renders the live spectrum, waveform and zone gauge.
- The student records the healthy baseline at commissioning and documents the first deliberately-introduced fault (e.g. an unbalance mass) and its 1X signature for the report.
Tech stack:
- ESP32 (controller)
- ADXL345-class MEMS accelerometer
- DS18B20 temperature sensor
- Edge FFT signal processing
- MQTT telemetry
- Web dashboard (HTML, CSS, JavaScript)
- Arduino IDE (C/C++ firmware)
- 16x2 LCD for on-node readout
| Parameter | Value |
|---|---|
| Sensor | ADXL345-class triaxial MEMS (±16 g range) |
| Sampling rate | 1.6 kS/s per axis (design) |
| FFT | 1024-point, Hanning window, on-controller |
| Spectrum range | 0–500 Hz (design) |
| Severity standard | ISO 10816, machine group 2 (15–300 kW) |
| Zone limits (group 2) | A <1.4, B 1.4–2.8, C 2.8–4.5, D >4.5 mm/s RMS |
| Temperature | DS18B20, limit 80°C with trend watch |
| Trend upload | Every 10 min over MQTT (configurable) |
| Demo machine | Single-phase induction motor, 50 Hz, 2-pole |
| Sensor noise floor | Approximately 290 µg/√Hz (datasheet) — fine for severity trending |
Project features
- [1.6 kHz triaxial sampling] An ADXL345-class MEMS accelerometer streams vibration data at 1.6 kS/s, fast enough to resolve spectra up to 500 Hz on a 50 Hz machine.
- [Edge FFT] A 1024-point FFT runs on the controller, so spectra are computed at the machine and only compact results travel over the network.
- [ISO 10816 severity gauge] Overall velocity in mm/s RMS is judged against ISO 10816 zones A (good) through D (danger) for the machine's power group.
- [Fault-frequency markers] The dashboard marks 1X (unbalance), 2X (misalignment) and the bearing's BPFI line, turning a raw spectrum into a readable diagnosis.
- [Live time waveform] A scrolling waveform view shows the raw vibration signal for classroom demonstration of periodic vs impulsive content.
- [Bearing temperature channel] A DS18B20 tracks bearing temperature alongside vibration, since heat plus vibration rise together in failing bearings.
- [Trend upload] Spectra summaries and overall values publish over MQTT every 10 minutes for long-term trend archives.
- [Buyer-run baseline] A commissioning procedure records the machine's healthy baseline spectrum, so every later alarm is judged against the student's own machine.
What is included
- Vibration sensor node: ESP32, MEMS accelerometer, temperature sensor, LCD, mounting hardware
- Demo motor rig with bearing-housing sensor mount
- Firmware with sampling, windowing, FFT and ISO zone logic
- Web dashboard source (spectrum, waveform, zone gauge, alarms)
- Baseline-recording and fault-introduction procedure for the report
- Bearing fault-frequency worksheet (BPFI from buyer-entered geometry)
- Project report PDF (vibration theory, FFT, ISO 10816, fault signatures)
- PPT presentation for final review
- Viva Q&A preparation document (sampling, aliasing, windowing, 1X/2X, bearing frequencies)
Limitations & prerequisites
- A MEMS accelerometer is not a piezoelectric industrial sensor: its noise floor suits severity trending and teaching, not precision diagnostics — stated openly in the report.
- BPFI marking needs the bearing's geometry (ball count, diameters), which the buyer enters; wrong geometry gives a wrong marker.
- The demo is a small single-phase motor; large-machine zone limits differ and are a configuration input, not a claim.
- Single measurement point (drive-end radial) — full analysis uses multiple points and axes, documented as an extension.
- This is a teaching and trending instrument, not a safety-critical protection system.
Frequently Asked Questions
Why a MEMS sensor instead of a piezo accelerometer?
Cost and interfacing: the MEMS chip talks I2C directly to the ESP32 and is plenty for severity trending and teaching. Its higher noise floor is documented, so nobody mistakes this for a precision analyzer.
What is ISO 10816?
The standard that judges machine vibration severity in mm/s RMS with zones A (good) to D (danger), with limits depending on machine size and mounting. The dashboard applies the group-2 limits for the demo machine.
How are faults identified from the spectrum?
Each fault has a signature: unbalance raises 1X (running speed), misalignment raises 2X, bearing defects raise the bearing's characteristic frequencies like BPFI. The dashboard marks these lines so the pattern is readable.
Why sample at 1.6 kHz?
To resolve the 0–500 Hz band of interest with margin above it, per the sampling theorem — with the practical note that real analyzers sample far faster for high-frequency bearing analysis.
Can it predict bearing failure?
It trends the indicators that precede failure (rising BPFI, rising temperature, crest factor) — that is condition monitoring. Guaranteed prediction of remaining life is not claimed.
Is this project suitable for a final-year project?
Yes — for Electronics, Mechanical and Instrumentation programs. It combines sensor interfacing, digital signal processing, standards-based judgement and a working dashboard. Suitable for B.E./B.Tech final-year projects in Electronics, Mechanical and Instrumentation.
Components & software requirements
- ESP32 (controller)
- ADXL345-class MEMS accelerometer
- DS18B20 temperature sensor
- Edge FFT signal processing
- MQTT telemetry
- Web dashboard (HTML, CSS, JavaScript)
- Arduino IDE (C/C++ firmware)
- 16x2 LCD for on-node readout
Delivery information
Built-to-order project. Delivery timeline is shared after order confirmation based on current queue.
Support terms
Complete documentation, setup guide, and viva preparation included. Support for setup and explanation provided.
Download free synopsis (PDF)
Enter your name and WhatsApp number — the synopsis PDF downloads immediately. We may send occasional project updates on WhatsApp; no spam.