
More project photos (2)
The problem
Teachers and timetable planners often have no reliable way to know how many people are actually inside a classroom at a given moment, so room bookings, seating plans, and headcounts during drills rely on guesswork or a manual count at the door. The IoT-Based Smart Classroom Occupancy Counter with ESP32-CAM and Live Dashboard solves that problem by mounting a small camera unit above the classroom doorway, counting each person as they enter or leave, keeping a running total of people inside, and showing that total live on a dashboard with capacity percentage and alerts. The unit counts shapes crossing the doorway, not faces, so no identifiable image is stored or sent anywhere. A teacher glancing at the dashboard can see at once whether seats remain, whether the room is near full, and how occupancy changed across the day, without anyone standing at the door with a register.
Builder note from the design: two virtual lines beat one line because a single line can only say that someone crossed, while two lines record crossing order, and crossing order is what separates an entry from an exit. The same note explains the main failure mode honestly: when two people walk through the doorway side by side, their shapes merge into one crossing in the camera view, and the count can miss one of them. This is a counting project, not a room-automation project: it switches nothing on or off, and it controls no lights, fans, or appliances. What it delivers is a trustworthy live number for one doorway, with its limits stated plainly.
How it works
The camera watches the doorway from above, and the counting logic treats the doorway view as a gate with two virtual lines drawn across it, one nearer the corridor and one nearer the room. When a person crosses both lines, the order of the two crossings decides the direction: corridor-side first means an entry, room-side first means an exit, and the running room total goes up or down by one person accordingly. The unit publishes that updated total over Wi-Fi using MQTT, and the dashboard redraws the count, the capacity percentage, the hourly chart, and the alert state from the latest message. If Wi-Fi drops, the unit keeps its last count and keeps counting locally, then sends the corrected total when the connection returns, so the dashboard shows a held figure rather than inventing one. Nothing in this chain identifies a person: frames are examined only to detect crossings, and no image is stored or sent.
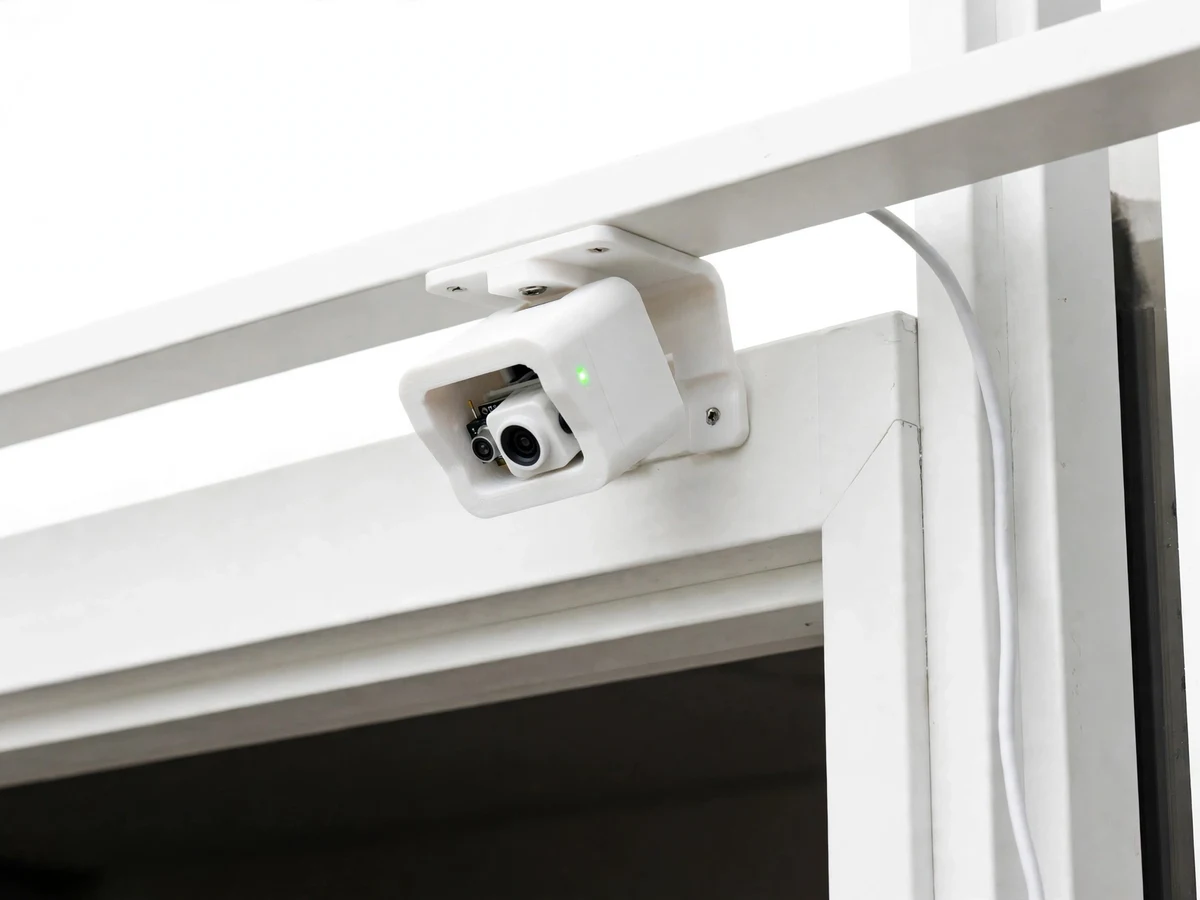
- The ESP32-CAM unit is mounted above the doorway, angled down so its view covers the full doorway width, and the two virtual lines are positioned across that view during setup.
- The counting firmware examines frames at 5 frames per second (design target for the counting pipeline) and tracks each moving shape as it approaches, crosses, and leaves the two lines.
- Crossing order decides direction: a shape crossing the corridor-side line first and then the room-side line adds one person to the room total, and the reverse order subtracts one person.
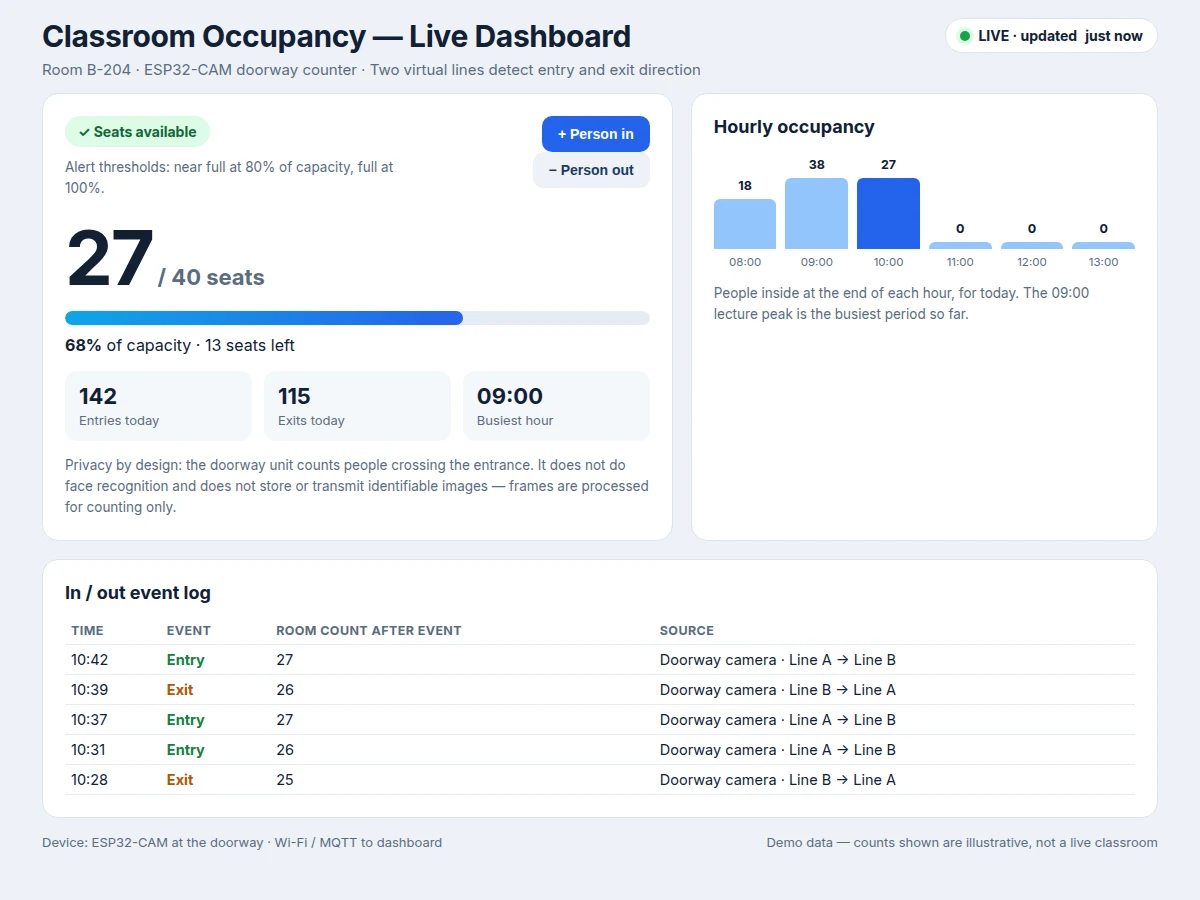
- The updated total is published over Wi-Fi using MQTT to the dashboard feed, which redraws the count, the capacity percentage, the hourly chart, and the alert state.
- Every crossing is also written to the timestamped in/out event log with the room count after that event, so the live total can be checked against its own history.
- When the total reaches 80% of configured capacity the dashboard shows the near-full state, and at 100% of configured capacity it shows the full state, until exits bring the total back down.
Tech stack:
- ESP32-CAM with OV2640 camera sensor
- Arduino IDE with ESP32 firmware for on-device counting
- Wi-Fi with MQTT messaging to the dashboard
- HTML, CSS and JavaScript live dashboard with hourly chart
- 5 V USB power supply for the doorway unit
| Parameter | Value |
|---|---|
| Controller and camera | ESP32-CAM module with OV2640 sensor (datasheet value: 2-megapixel sensor) |
| Counting method | Two virtual lines across the doorway view, direction by crossing order |
| Counting frame rate | 5 frames per second (design target for the counting pipeline) |
| Connectivity | Wi-Fi 802.11 b/g/n (datasheet value) with MQTT messaging |
| Dashboard update interval | Every 2 seconds (design target) while connected |
| Configured capacity (design example) | 40 seats (configured value, not a fire-code figure) |
| Alert thresholds | Near full at 80% of configured capacity, full at 100% of configured capacity (configured values) |
| Power supply | 5 V DC via USB adapter (datasheet value for the module input) |
| Mounting height | Approximately 2.2 m above floor level (design target, above the doorway) |
| Dashboard history | 24 hours of hourly occupancy data (design target) |
Project features
Direction-aware counting, a live count with capacity percentage, an hourly occupancy chart with full and near-full alerts, and privacy-by-design counting are the four capabilities that define this project. The doorway unit works out entry versus exit from crossing order rather than from any identity check, so the dashboard number moves in the right direction as people come and go. The dashboard pairs that live number with a capacity percentage, an hourly chart that shows when the room was busiest, and alerts that warn before the room fills, while the event log records every crossing with its time. Nothing in the chain recognises a face or keeps a photograph, which keeps the system acceptable in a classroom where recording people would not be. The first six features below are in the base build; the last two are optional add-ons agreed before delivery.
- [Direction-aware in/out counting — base build] Two virtual lines across the doorway view record crossing order, so outer-then-inner counts as an entry and inner-then-outer counts as an exit, and the running room total updates on every crossing.
- [Live count with capacity percentage — base build] The dashboard shows the current room count beside the configured capacity, with the capacity percentage and the number of seats remaining, updating as each crossing is published.
- [Hourly occupancy chart — base build] Occupancy at the end of each hour is charted for the day, so the busiest hour and the pattern across lectures are visible without reading through the raw event log.
- [Full and near-full alerts — base build] The dashboard flags near full at 80% of configured capacity and full at 100% of configured capacity, so staff see pressure building before the room actually fills.
- [Timestamped in/out event log — base build] Every entry and exit is logged with its time and the room count after that event, giving a checkable trail when the live total is ever questioned.
- [Privacy-by-design counting — base build] Frames are processed for counting only: the unit performs no face recognition and stores or transmits no identifiable images, and any deployment that needs recording is out of scope for this build.
- [Second doorway unit — optional add-on] A second doorway unit can be added for a room with two entrances, with both units reporting to the same dashboard so one room total covers either door.
- [Doorway display screen — optional add-on] A small display at the doorway can show the live count and the seats-remaining figure to people arriving, so they need not open the dashboard to decide whether to enter.
What is included
- One doorway camera unit in a white mount enclosure with USB power supply
- Counting firmware with two-line direction detection and MQTT publishing
- Live dashboard with current count, capacity percentage, hourly chart, alert states, and in/out event log
- Setup guide for mounting height, camera angle, virtual-line positioning, and capacity configuration
- Project report PDF (background, working, circuit and dashboard details, results, limitations)
- PPT presentation for final review
- Viva Q&A preparation document (counting logic, MQTT flow, privacy design, limitations)
Limitations & prerequisites
- Accuracy drops when two people enter side by side, because their shapes can merge into one crossing in the camera view and one person can be missed.
- Poor doorway lighting degrades detection: a dim or strongly backlit doorway makes shapes harder to separate, so the doorway needs adequate, even lighting.
- Camera angle matters: a unit mounted too low, too far to one side, or with part of the doorway out of view will miscount, and the setup guide must be followed for the angle.
- During a Wi-Fi outage the dashboard count is held and goes stale rather than updating; the unit keeps counting locally and corrects the total when the connection returns, but the live view is not live until then.
- The capacity figure is a configured number chosen for the room, not a fire-code or statutory occupancy limit, and it must never be presented as one.
- Fast crowds at changeover between lectures are the hardest case: people crossing in a dense stream are more likely to merge in the camera view than people crossing one at a time.
Frequently Asked Questions
How does the counter tell entries apart from exits without recognising anyone?
It watches two virtual lines drawn across the doorway view and records the order in which a person crosses them, so crossing the outer line first and then the inner line counts as an entry, while the reverse order counts as an exit, and no face or identity is ever checked. A single line could only say that someone crossed, which is why the two-line order matters: the sequence itself carries the direction. The unit works on moving shapes in the frame, not on stored photographs, and no image leaves the device.
Is this project suitable for a final-year project?
Yes, it fits electronics, electrical, and IoT programmes because it combines an embedded camera build, wireless messaging, and a live dashboard into one complete system that a team can build, test, and demonstrate in a review with a working doorway unit rather than only slides. The counting logic gives a genuine technical discussion: virtual lines, crossing order, failure modes under side-by-side entry and poor lighting, and the MQTT path from doorway to dashboard. The report and dashboard demo give reviewers something concrete to examine beyond slides.
What happens to the count when Wi-Fi drops?
The doorway unit keeps its last count in memory and keeps counting locally while the connection is down, then sends the corrected total to the dashboard once Wi-Fi returns, so the dashboard shows a held, clearly stale figure rather than an invented one. This is a deliberate choice: a frozen count that is honest about being stale is safer than a guessed number. Staff should treat the dashboard as out of date until the connection indicator shows live updates again.
How accurate is the count, and is a percentage claimed?
No fixed accuracy percentage is claimed for this build, because real accuracy depends on doorway width, lighting, camera angle, and how often people enter side by side, and any single percentage would hide those conditions for the doorway where it will actually be installed. In a well-lit single doorway with people entering one at a time, the two-line method tracks crossings reliably; in a dim doorway or a dense changeover crowd, misses become more likely. The honest way to report accuracy is to test the installed unit at its own doorway and record the results.
Can one room with two doors use this system?
Yes, a second doorway unit can be added for a room with two entrances, with both units reporting to the same dashboard so the room total adds entries and subtracts exits from either door and staff see one combined room total instead of two separate doorway counts. This is an optional add-on agreed before delivery, not part of the single-door base build, because each doorway needs its own unit, mounting, and line setup. The dashboard then shows one combined room total with a per-door event log.
What does the dashboard show, and can the capacity be changed?
The dashboard shows the current room count, the configured capacity, the capacity percentage, an hourly occupancy chart, and a timestamped in/out event log, with alerts at the near-full and full thresholds, and the capacity number itself can be changed in settings for a different room size. Changing the capacity only changes the percentage and the alert points; it never changes the counted total, which comes from doorway crossings alone. The hourly chart and event log update from the same published totals, so the views stay consistent with each other.
Components & software requirements
- ESP32-CAM with OV2640 camera sensor
- Arduino IDE with ESP32 firmware for on-device counting
- Wi-Fi with MQTT messaging to the dashboard
- HTML, CSS and JavaScript live dashboard with hourly chart
- 5 V USB power supply for the doorway unit
Delivery information
Built-to-order project. Delivery timeline is shared after order confirmation based on current queue.
Support terms
Complete documentation, setup guide, and viva preparation included. Support for setup and explanation provided.
Download free synopsis (PDF)
Enter your name and WhatsApp number — the synopsis PDF downloads immediately. We may send occasional project updates on WhatsApp; no spam.