
More project photos (2)

The problem
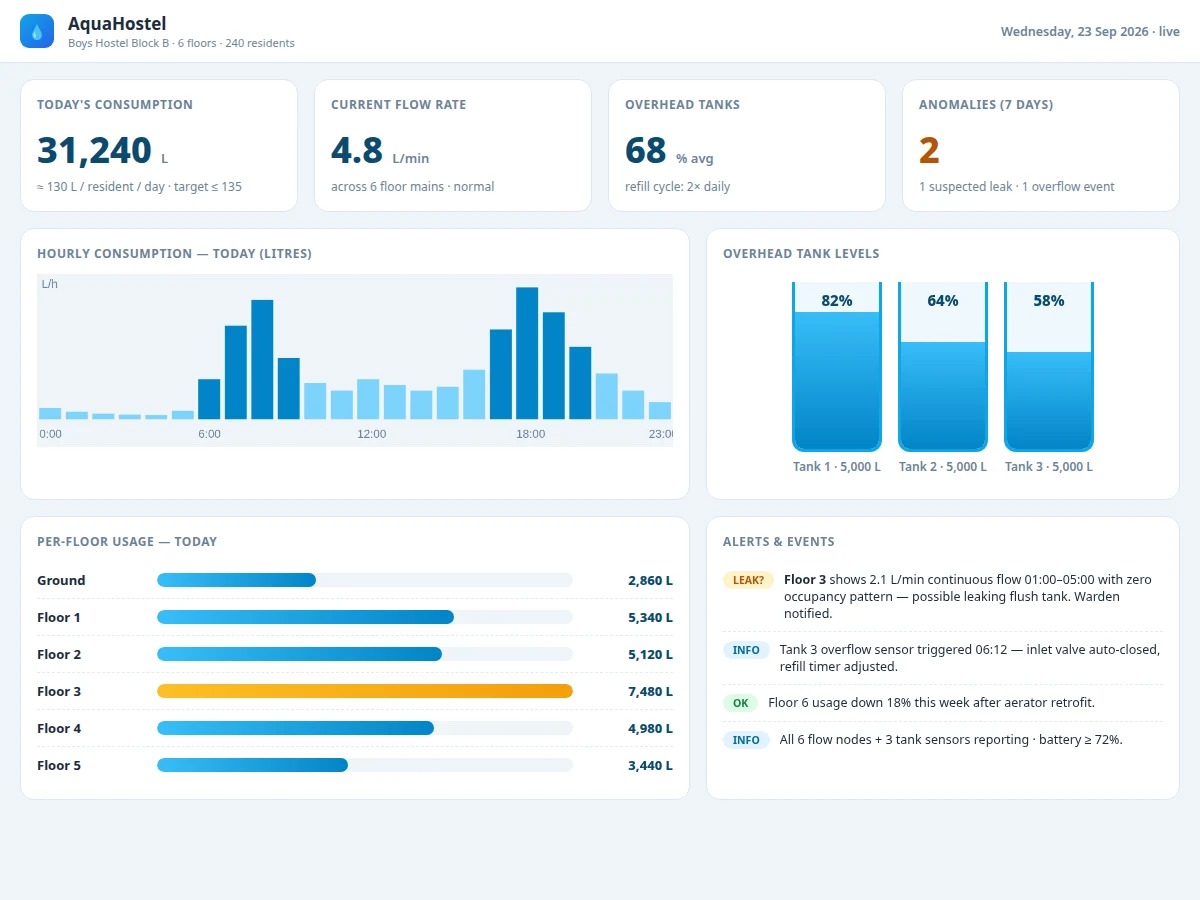
Hostels lose thousands of litres to leaks nobody sees: a running flush tank, a dripping tap row, an overflowing overhead tank at 6 a.m. The water bill arrives as one number, so nobody knows which floor wastes it or when. This project makes every litre visible. Flow sensors on each floor main measure consumption, ultrasonic sensors watch the overhead tank levels, and ESP32 nodes publish it all to a dashboard the warden can read on a phone. The interesting engineering is in the anomaly logic: continuous low flow through the night, when occupancy patterns say usage should be near zero, flags a suspected leak; an overflow sensor event auto-closes the inlet valve logic and adjusts the refill timer. The dashboard's hourly chart reveals the hostel's real rhythm — morning and evening peaks — and the per-floor bars make waste attributable. For the report, a week of data becomes a genuine conservation study: baseline, intervention (aerators on one floor), measured change.
How it works
- Each YF-S201 flow sensor outputs pulses proportional to flow; the ESP32 counts pulses and converts to litres per minute.
- Ultrasonic sensors measure the distance to the water surface in each overhead tank, converted to percentage and litres.
- Nodes publish flow and level readings every 60 seconds over Wi-Fi to the dashboard backend.
- The dashboard aggregates today's total, the hourly profile, per-floor bars and tank levels.
- The anomaly engine compares night-time flow (01:00–05:00) against the expected near-zero baseline; sustained flow flags a suspected leak for that floor.
- A tank-full event triggers the overflow response: inlet logic closed, refill timer adjusted, event logged.
- The student calibrates each sensor with the jug procedure and records the calibration factors in the report.
Tech stack:
- ESP32 sensor nodes
- YF-S201 flow sensors
- Ultrasonic level sensors (HC-SR04 class)
- Wi-Fi telemetry
- Dashboard (HTML/CSS/JS + charts)
- Relay/valve control logic
| Parameter | Value |
|---|---|
| Flow sensors | YF-S201, 1–30 L/min range per sensor |
| Flow accuracy | Approximately ±10% after buyer jug-calibration (design target) |
| Level sensing | Ultrasonic, 2–400 cm (design) |
| Reporting interval | 60 s (configurable) |
| Tanks | 3 × 5,000 L overhead (demo scale) |
| Anomaly window | 01:00–05:00 night baseline |
| Dashboard target | ≤ 135 L/resident/day benchmark |
| Nodes | 6 floor + 3 tank (design) |
Project features
- [Per-floor flow sensing] YF-S201 flow sensors on each floor main, reporting litres per minute and cumulative consumption.
- [Tank level monitoring] Ultrasonic sensors on overhead tanks with live level visualisation and refill-cycle tracking.
- [Hourly consumption chart] 24-hour usage profile revealing morning/evening peaks and night-time baselines.
- [Leak anomaly detection] Continuous night flow against the occupancy pattern raises a suspected-leak alert with the floor identified.
- [Overflow protection logic] Tank-full event closes the inlet-valve logic and adjusts the refill timer automatically.
- [Per-floor comparison] Usage bars per floor supporting before/after conservation studies (e.g. aerator retrofits).
- [Warden dashboard] Today's total, per-resident average against the 135 L/day target, tank levels and alerts in one view.
- [Calibration procedure] Buyer-run jug-calibration for each flow sensor, documented with the report's accuracy notes.
What is included
- Flow-sensing prototype rig (pipe section, flow sensor, tank model, level sensor)
- ESP32 node firmware (pulse counting, level reading, Wi-Fi publish, anomaly logic)
- Water usage dashboard web app
- Jug-calibration procedure per sensor
- Plumbing and wiring layout guide
- Project report PDF (background, flow sensing, telemetry, conservation analysis)
- PPT presentation for final review
- Viva Q&A preparation document (flow sensors, ultrasonics, anomaly detection, calibration)
Limitations & prerequisites
- Flow accuracy is approximately ±10% after calibration — a design target, honestly stated; the report documents the buyer's calibration results, not a claimed figure.
- The leak flag is heuristic (night flow vs occupancy pattern), not a certified leak detector; it nominates floors for inspection.
- Ultrasonic level readings need a stilling arrangement; ripples and tank ribs add noise — the mounting guide addresses this.
- The demo rig models one building; campus-wide deployment needs per-building calibration (noted as scaling guidance).
- Valve actuation is demonstrated as control logic; plumbing in a real hostel needs a licensed plumber and the warden's approval.
Frequently Asked Questions
How does it detect a leak if it can't see water?
By pattern: between 01:00 and 05:00 a hostel floor should use almost no water. Sustained flow in that window with nobody around means water is going somewhere unintended — almost always a leaking flush tank or tap. The dashboard names the floor so maintenance can check one place.
How accurate are the flow sensors?
About ±10% after the jug-calibration procedure that ships with the project — you run a known volume through and set the calibration factor. The report records your calibration, not a factory claim.
What does the per-resident number tell the warden?
Whether the hostel beats the 135 L/day benchmark and which floors drag the average up. After an intervention (aerators, fixed flush tanks), the before/after bars show the saving in litres.
Does it need internet?
The dashboard runs on the local network. Cloud access for off-site viewing is an optional extension, not in the base build.
Can it actually close a valve?
The control logic is implemented and demonstrated on the rig with a relay driving a solenoid valve. Real-hostel plumbing work is out of scope for the student build.
Is this project suitable for a final-year project?
Yes — for Electronics, Electrical and IoT programs. It combines sensing, embedded networking, data analysis and a conservation story with measurable outcomes. Suitable for B.E./B.Tech final-year projects in Electronics, Electrical and IoT & Embedded Systems.
Components & software requirements
- ESP32 sensor nodes
- YF-S201 flow sensors
- Ultrasonic level sensors (HC-SR04 class)
- Wi-Fi telemetry
- Dashboard (HTML/CSS/JS + charts)
- Relay/valve control logic
Delivery information
Built-to-order project. Delivery timeline is shared after order confirmation based on current queue.
Support terms
Complete documentation, setup guide, and viva preparation included. Support for setup and explanation provided.