
More project photos (3)


The problem
Every campus knows the 1 p.m. canteen crush: long queues, no seats, and students who time it wrong twice a day. The canteen staff, meanwhile, staff counters by gut feel. Both sides lack the same thing — live numbers. This project instruments the canteen with honest, low-cost sensing: an infrared beam pair at the entrance counts people in and out, ESP32-CAM modules at each counter estimate queue length with lightweight on-device image differencing (counts only, no faces, no recording), and a seating-zone estimate completes the picture. The dashboard converts raw counts into decisions: current wait per counter from queue length times measured service time, a footfall curve showing today's rhythm, and a heatmap of the typical weekday built from four weeks of history so students learn the calm windows (10:00–11:30, after 14:30). Menu-rush alerts warn when the Friday special thali is about to spike demand. It is a complete sense–decide–display IoT loop with a user base of hundreds.
Overhead IR beam pair at the entrance detects passage direction. Entries minus exits gives the live people-inside count.
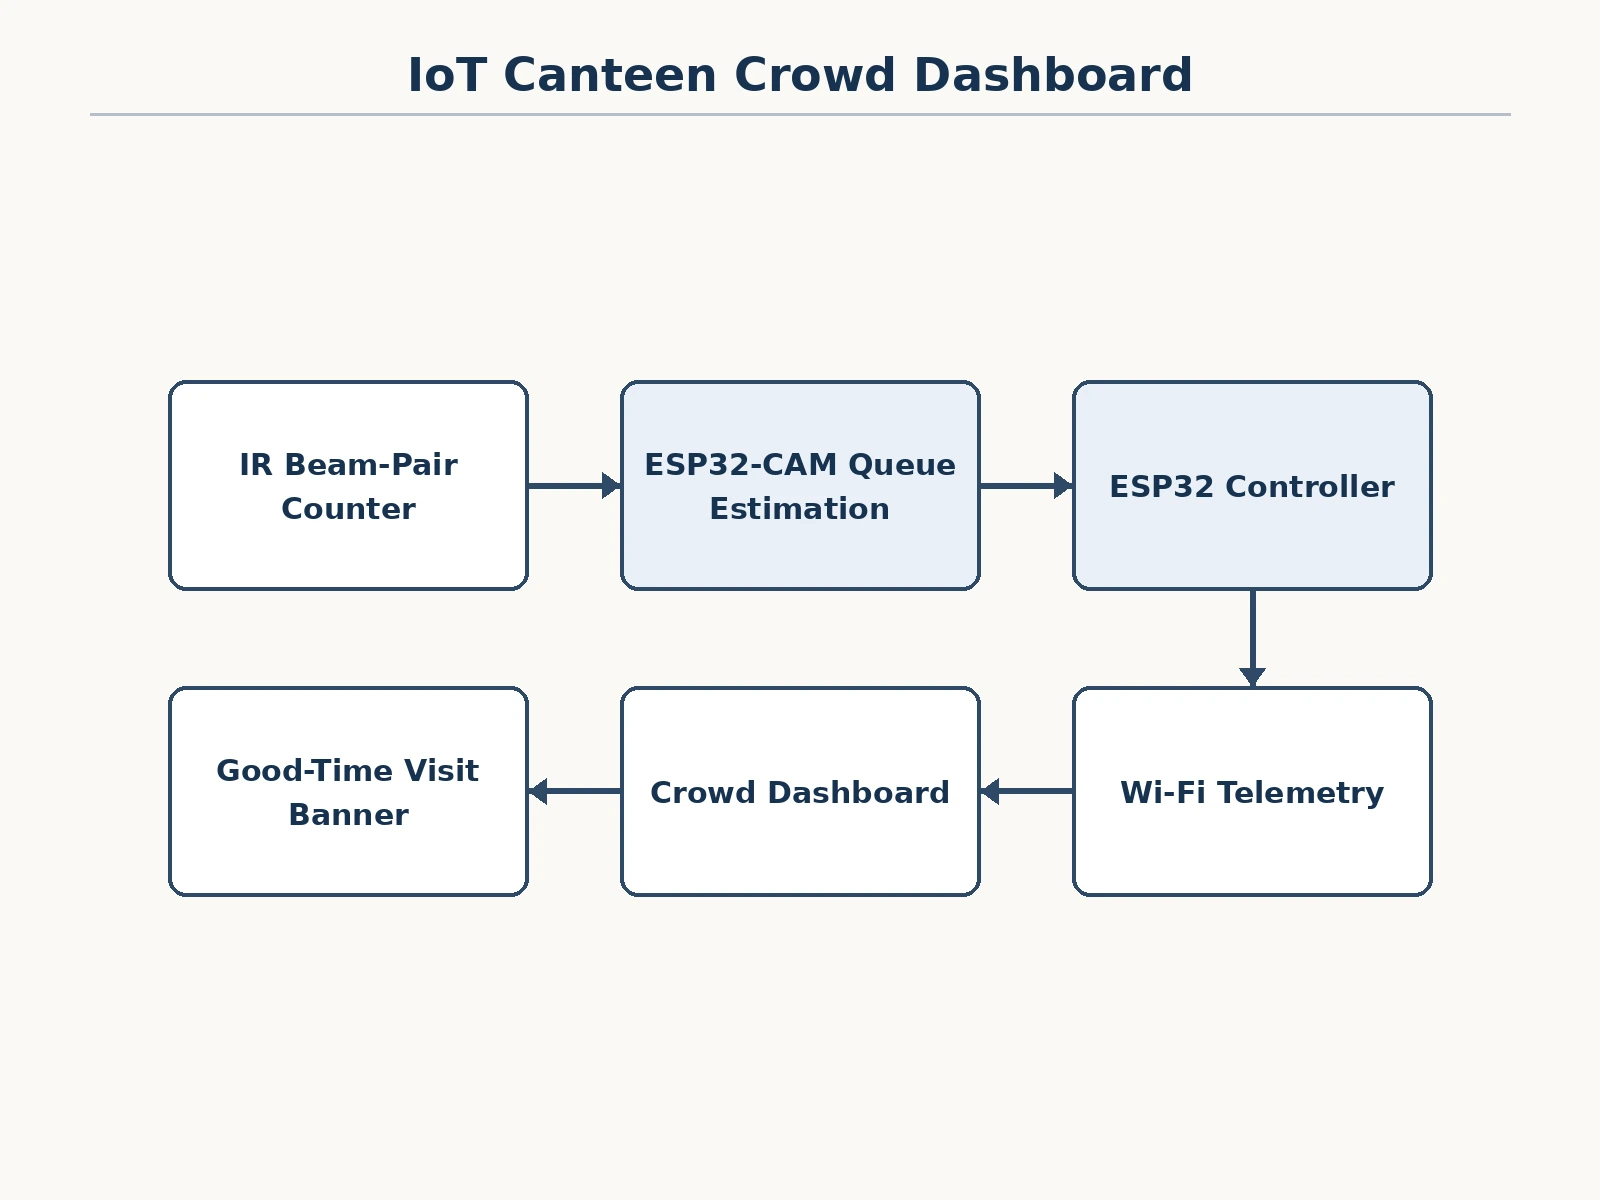
Follow the working sequence
How it works
- The IR beam pair at the entrance detects direction of passage; entries minus exits gives the live inside count.
- Each ESP32-CAM captures low-resolution frames at intervals and runs frame-differencing against the empty-counter baseline to estimate queue length.
- The firmware converts queue length to wait time using the measured average service time per counter (calibrated by the student).
- Nodes publish counts every 30 seconds over Wi-Fi; the dashboard aggregates people-inside, per-counter queues, seating and footfall.
- The heatmap module bins four weeks of history by time slot to label each window calm, busy or packed.
- Alert rules fire on queue thresholds and scheduled menu events; the visit banner reflects crowd vs the comfort threshold.
- The student calibrates service times and validates counts against manual tallies using the included procedure.
Tech stack:
- ESP32 + ESP32-CAM modules
- IR beam-pair people counter
- On-device frame differencing
- Wi-Fi telemetry (30 s reports)
- Crowd analytics (wait-time model, heatmap)
- Dashboard (HTML/CSS/JS + canvas charts)
| Parameter | Value |
|---|---|
| Counters monitored | 3 (meals, snacks, beverages) |
| Capacity | 220 people (design) |
| Comfort threshold | 140 people (design) |
| Count accuracy | Approximately ±5% for beam pair after calibration (design target) |
| Queue estimate | Frame-differencing count, no facial recognition |
| Reporting interval | 30 s |
| History | 4 weeks rolling for heatmap |
| Privacy | No stored images, no identities |
Project features
- [Entry/exit counting] Overhead IR beam pair at the main door maintaining the live people-inside count against the 220 capacity.
- [Queue estimation] ESP32-CAM units at counters estimating queue length with on-device frame differencing — counts only, no facial recognition, no stored images.
- [Wait-time estimates] Queue length × measured average service time per counter, updated live.
- [Seating occupancy] Seating-zone estimate showing 64/140-style availability.
- [Footfall curve] Today's entry/exit history revealing breakfast, lunch and evening peaks.
- [Rush heatmap] Typical-weekday crowd heatmap from four weeks of sensor history, marking calm vs packed windows.
- [Menu-rush alerts] Configurable alerts for known demand spikes (Friday special thali) and live queue thresholds.
- [Visit banner] A "good time to visit" indicator driven by current crowd vs comfort threshold (140).
What is included
- Canteen counter prototype rig (model counter, ESP32-CAM, IR beam pair, display)
- ESP32 firmware (counting, queue estimation, Wi-Fi publish)
- Crowd dashboard web app
- Service-time calibration and count-validation procedure
- Deployment layout guide (camera angles, beam mounting)
- Project report PDF (background, people counting, queueing basics, methodology)
- PPT presentation for final review
- Viva Q&A preparation document (IR sensing, ESP32-CAM, queueing theory, privacy)
Limitations & prerequisites
- Camera queue estimates are approximate (design target, not a measured claim); occlusion and lighting affect them — validated by the buyer's manual-tally procedure.
- No facial recognition and no stored images by design; the system cannot identify individuals (stated as a privacy feature, also a limitation for analytics).
- The beam pair miscounts on tailgating (two people, one break); the error budget is documented.
- Wait times assume the measured average service time; a slow cook or a card-machine outage breaks the estimate — noted honestly.
- The 4-week heatmap needs 4 weeks of data; the demo ships with representative seed history, clearly labelled as such.
Frequently Asked Questions
Does the camera record students?
No. The ESP32-CAM processes low-resolution frames on-device to estimate a queue count and discards the frames immediately. Nothing is stored, transmitted or recognisable — the report documents this privacy design.
How accurate is the people count?
The IR beam pair is approximately ±5% after calibration against manual tallies — a design target the student verifies with the included procedure. Tailgating is the known error source.
How is wait time estimated?
Queue length multiplied by the measured average service time for that counter (e.g. 14 in queue × ~26 s each ≈ 6 min). The student measures the service time during calibration.
What is the heatmap for?
It turns four weeks of history into advice: which time windows are calm, busy or packed on a typical weekday — so students plan visits and staff plan counter staffing.
Can the canteen staff use it too?
Yes — the per-counter queues and rush alerts are exactly the staffing signals a canteen manager needs; the report includes a staff-view description.
Is this project suitable for a final-year project?
Yes — for Electronics, Computer Science and IoT programs. It combines embedded vision, sensing, queueing theory and a dashboard used by real people daily. Suitable for B.E./B.Tech final-year projects in Electronics, Computer Science and IoT & Embedded Systems.
Components & software requirements
- ESP32 + ESP32-CAM modules
- IR beam-pair people counter
- On-device frame differencing
- Wi-Fi telemetry (30 s reports)
- Crowd analytics (wait-time model, heatmap)
- Dashboard (HTML/CSS/JS + canvas charts)
Delivery information
Built-to-order project. Delivery timeline is shared after order confirmation based on current queue.
Support terms
Complete documentation, setup guide, and viva preparation included. Support for setup and explanation provided.
Download free synopsis (PDF)
Enter your name and WhatsApp number — the synopsis PDF downloads immediately. We may send occasional project updates on WhatsApp; no spam.