
More project photos (5)
The problem
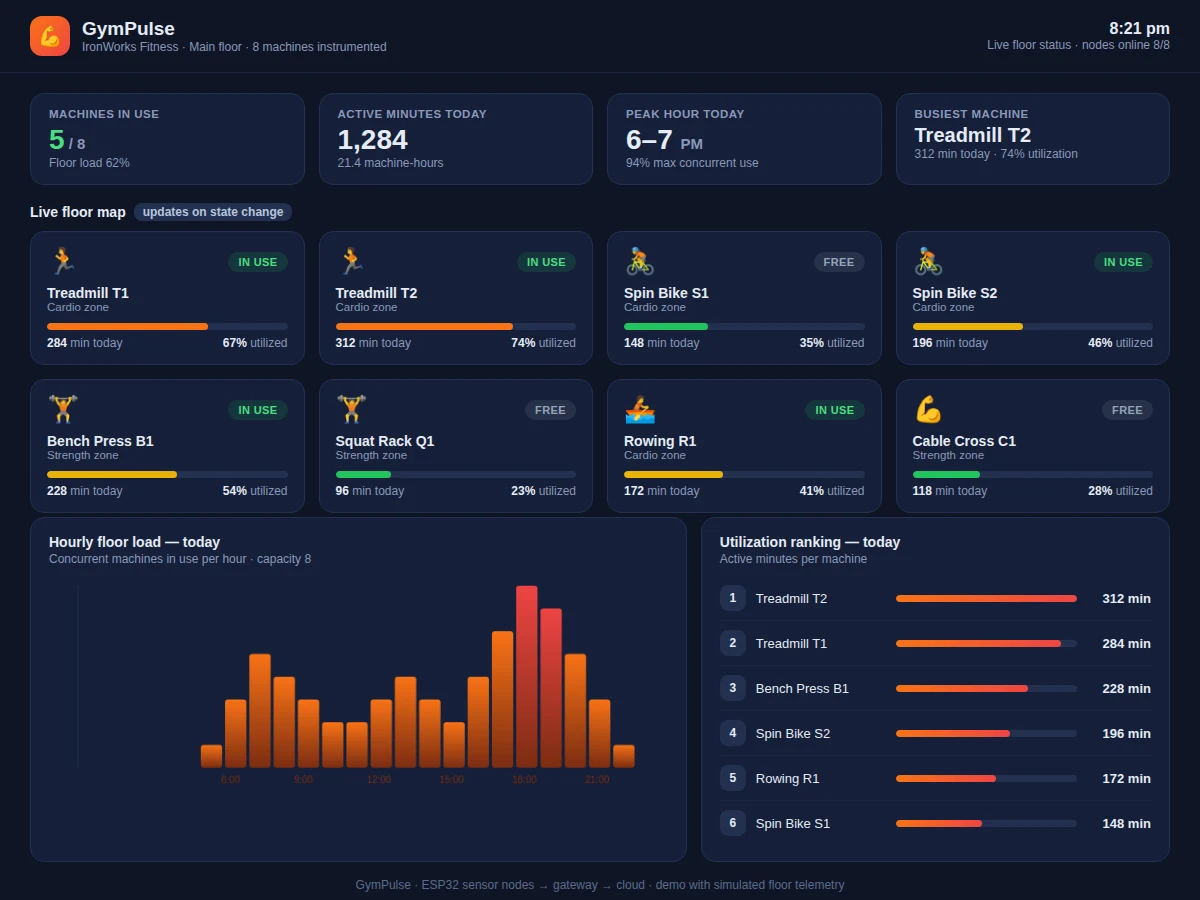
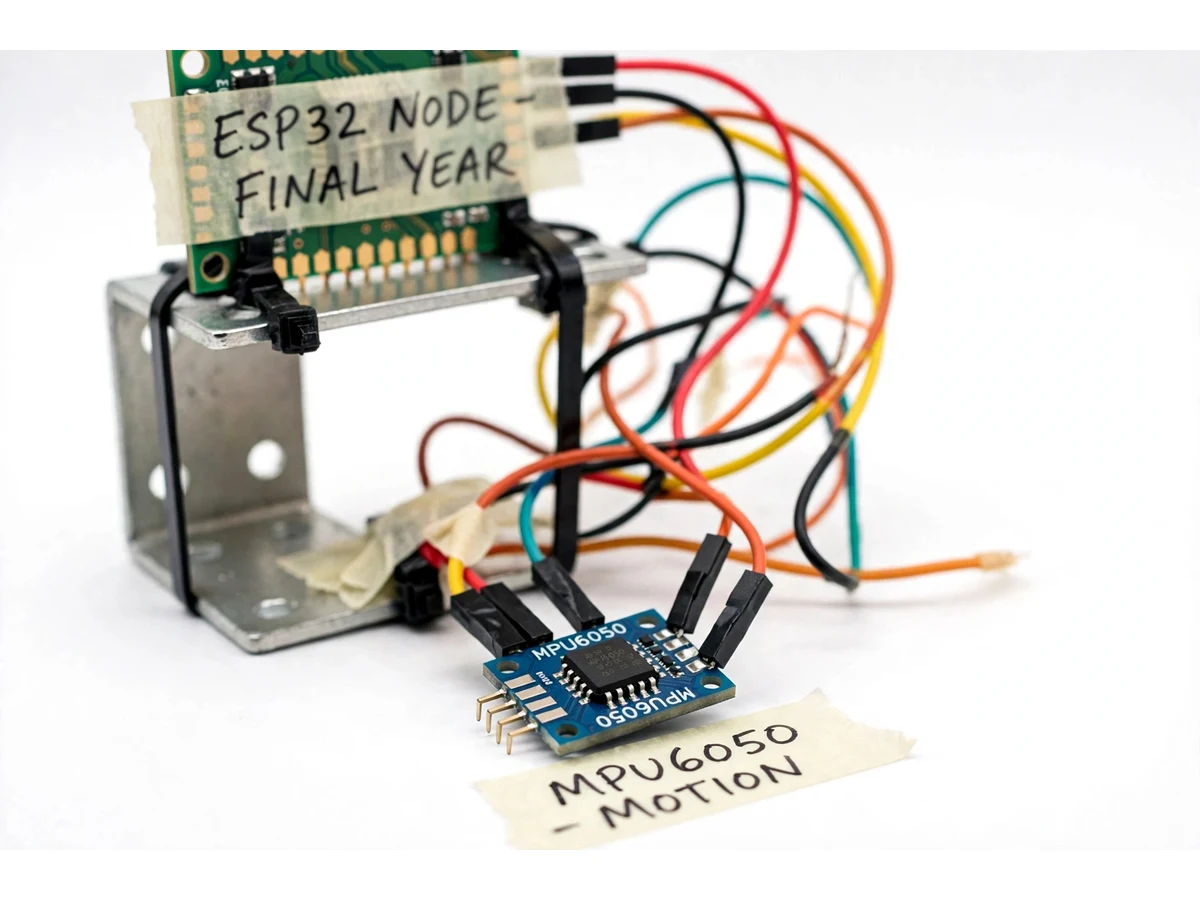
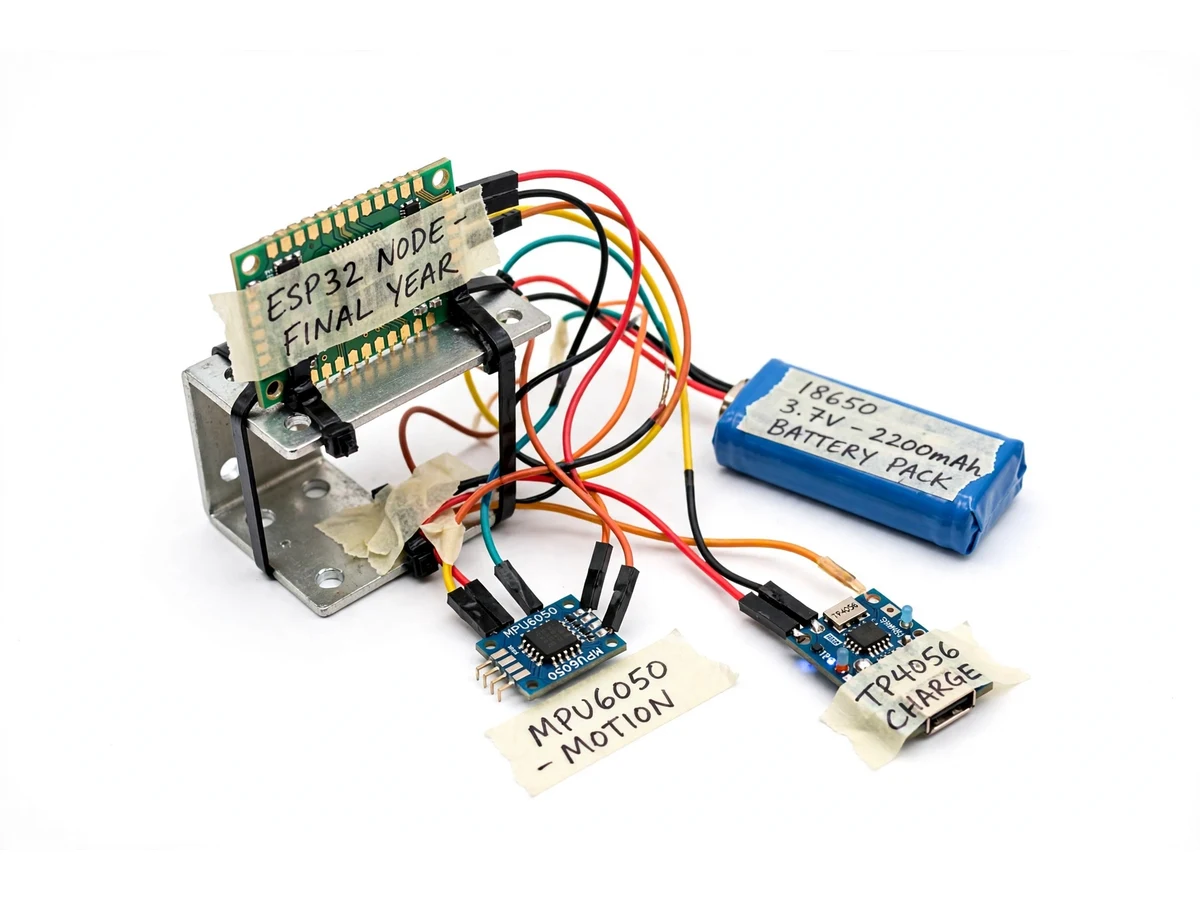
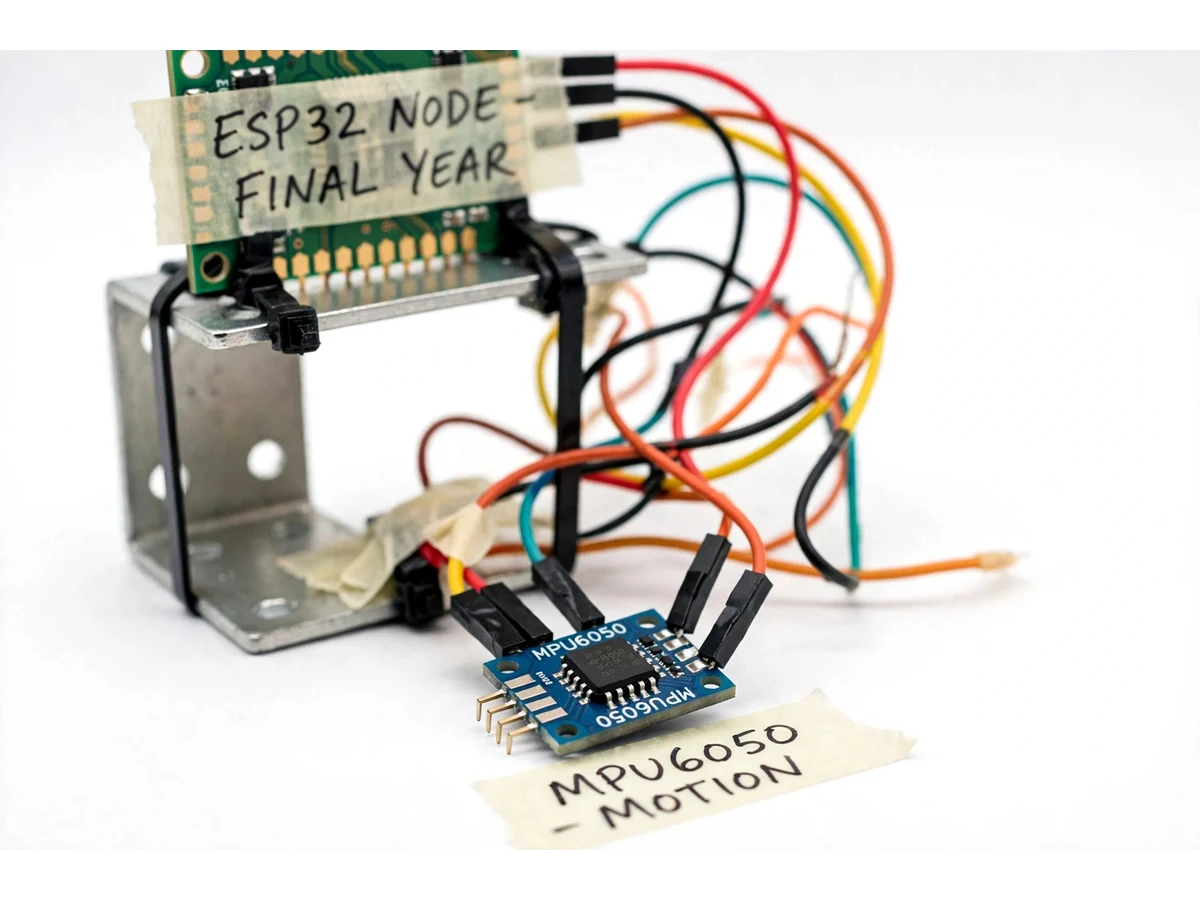
A gym floor is full of expensive equipment and thin data. Owners know the membership count but not the machine count that matters: how many minutes each treadmill, cycle and bench station actually works per day, which hours saturate the floor, and which machines sit idle while members queue elsewhere. Manual observation does not scale, and commercial gym-management software tracks billing, not equipment. This project instruments the machines themselves: compact sensor nodes (vibration/motion sensing on an ESP32-class board) mount on each piece of equipment and classify it as in-use or idle from its vibration signature, reporting state changes over Wi-Fi to a gateway that aggregates active minutes per machine. The cloud dashboard renders a live floor map with IN USE / FREE badges, per-machine utilization bars, a peak-hours heat view and daily totals — the exact numbers behind "we need another squat rack". The student delivers the sensing hardware, the gateway logic and a genuinely working dashboard demo.
How it works
- A sensor node is mounted on each machine (treadmill frame, cycle body, bench station); it samples its accelerometer/vibration sensor continuously at low duty cycle.
- Firmware classifies the machine as active when vibration energy exceeds the tuned threshold for the debounce period, and idle after sustained quiet — state changes are transmitted immediately.
- Nodes report over Wi-Fi to the gateway, which timestamps each state change and accumulates active minutes per machine in the cloud backend.
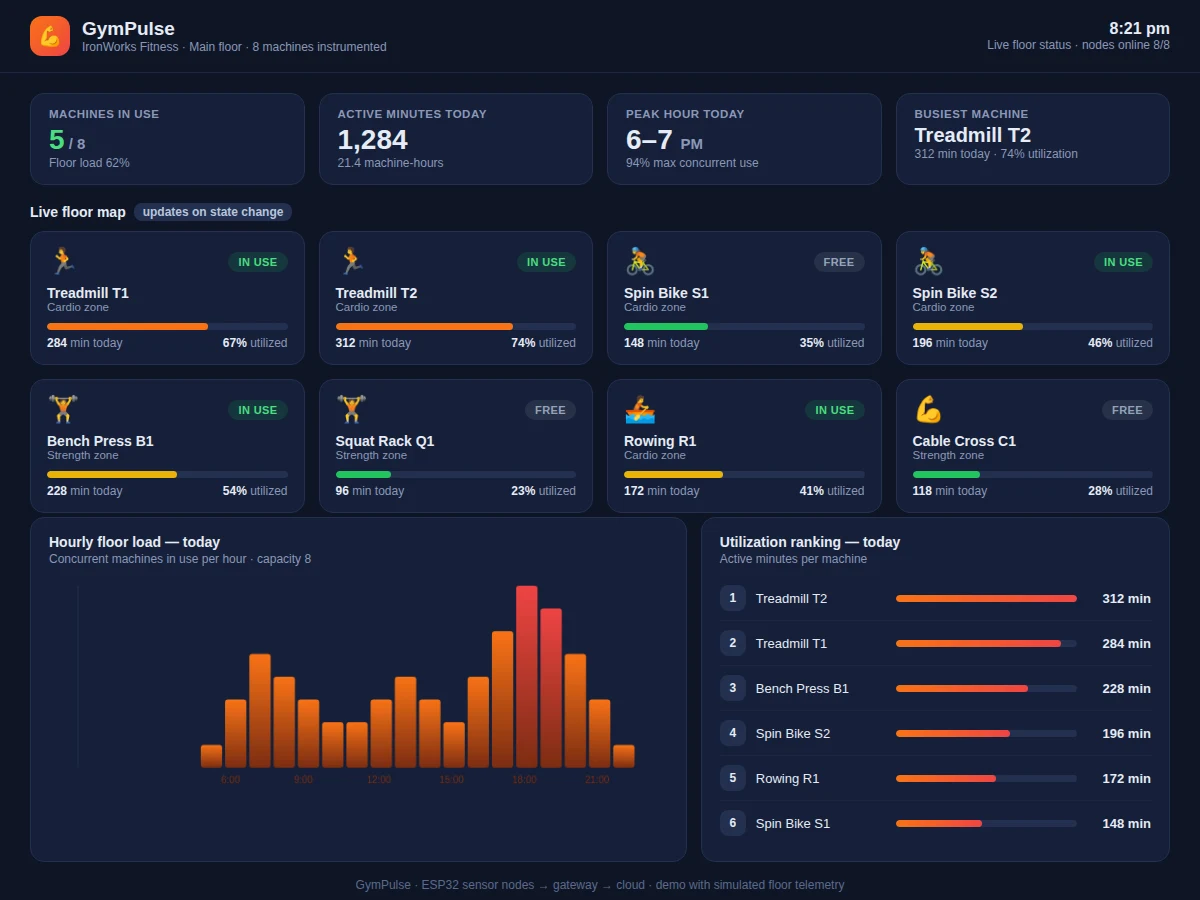
- The dashboard polls the backend to render the live floor map, per-machine utilization bars, the hourly peak pattern and the event log.
- A periodic heartbeat from each node confirms it is alive; a missed heartbeat raises a "node offline" flag on the dashboard.
- The student commissions the floor with the included procedure: mount nodes, tune the activity threshold per machine type with the tap-test, and log a supervised workout to validate classification.
Tech stack:
- ESP32-class sensor nodes (one per machine)
- MPU6050 / vibration sensor modules
- Wi-Fi telemetry to gateway + cloud backend
- Web dashboard (HTML/CSS/JS demo included)
- Arduino IDE (C/C++ firmware)
- Li-ion battery packs with charging modules
| Parameter | Value |
|---|---|
| Sensing | Vibration/motion signature per machine (design) |
| Classification | Threshold + debounce state machine (design) |
| Reporting | State change immediate + periodic heartbeat |
| Metrics | Active minutes, utilization %, peak hours |
| Nodes | Battery-powered, one per machine (design) |
| Dashboard | Live floor map, utilization bars, hourly pattern, event log |
| Range | Wi-Fi coverage of the gym floor |
Project features
- [Per-machine usage sensing] Compact wireless nodes detect real mechanical activity from vibration/motion signatures — a machine counts as used only when it is actually being worked, not when someone leans on it.
- [Live floor-status dashboard] Every instrumented machine shows IN USE or FREE in real time, so the dashboard doubles as a live floor map for staff and members.
- [Utilization analytics] Per-machine active minutes, utilization percentage of opening hours, and day-wise totals reveal which equipment earns its floor space.
- [Peak-hour patterns] An hourly usage view shows exactly when the floor saturates, supporting decisions on batch timings, staffing and new purchases.
- [Idle-vs-active classification] Firmware uses vibration thresholds with debounce timing so a bumped machine does not log a workout — the classification logic is documented and tunable.
- [Battery-friendly node design] Nodes sleep between checks and report on state change plus heartbeat, with the power budget analyzed in the report.
- [Working demo dashboard] A single-file web dashboard with realistic simulated floor telemetry is included for presentation and viva.
What is included
- Sensor node design (one node per machine in the demo set)
- Gateway firmware with aggregation logic
- Working single-file dashboard demo with simulated floor telemetry
- Mounting and threshold-tuning commissioning guide
- Project report PDF (theory, sensing, classification, dashboard, results)
- PPT presentation and viva Q&A document
Limitations & prerequisites
- Classification is threshold-based on vibration energy, not rep-counting — it measures active minutes, not sets, reps or user identity.
- Thresholds must be tuned per machine type; a setting that works on a treadmill may misread a light dumbbell rack — the tuning procedure is mandatory, not optional.
- The dashboard demo ships with simulated telemetry; live data appears only after nodes are mounted and connected.
- Wi-Fi must cover the whole floor; concrete basements may need an access point reposition.
- Battery life depends on activity levels; the report gives the power budget honestly rather than promising a fixed number.
- It tracks equipment, not members — no cameras, no identity, no personal data by design.
Frequently Asked Questions
Does it count reps or identify who is exercising?
Neither — by design. It measures active minutes per machine from vibration signatures. No cameras, no biometrics, no personal data; the report frames this as a privacy-positive choice.
How does it know the machine is really in use?
The node watches vibration energy: sustained energy above the tuned threshold (after a debounce period) means active use; a single bump does not. The tap-test tuning procedure sets this per machine type.
What does the dashboard show?
A live floor map (IN USE / FREE per machine), per-machine utilization bars, an hourly peak pattern, daily totals and a node-health view with offline flags.
Does the demo dashboard need hardware?
The included single-file dashboard runs on realistic simulated floor telemetry for presentation and viva; real nodes replace the simulator with live data through the same interface.
How many machines can it cover?
The architecture supports one node per machine reporting through the gateway; the demo documents a representative floor set and the report explains scaling.
Is this project suitable for a final-year project?
Yes — for IoT & Embedded, Electronics and Computer / IT programs. It combines wireless sensing, embedded classification, aggregation and a real analytics dashboard. Suitable for B.E./B.Tech final-year projects in IoT & Embedded, Electronics / E&TC and Computer / IT.
Components & software requirements
- ESP32-class sensor nodes (one per machine)
- MPU6050 / vibration sensor modules
- Wi-Fi telemetry to gateway + cloud backend
- Web dashboard (HTML/CSS/JS demo included)
- Arduino IDE (C/C++ firmware)
- Li-ion battery packs with charging modules
Delivery information
Built-to-order project. Delivery timeline is shared after order confirmation based on current queue.
Support terms
Complete documentation, setup guide, and viva preparation included. Support for setup and explanation provided.