
More project photos (2)
The problem
An IoT-based outdoor air pollution monitor is a field unit that measures airborne particles and gases at one location, converts the readings into an Air Quality Index, and shares that index on a local display and a cloud dashboard. The direct answer to the target question is this: this project gives a student a working outdoor station that continuously reports PM1.0, PM2.5 and PM10, a relative gas level, temperature and humidity, so a campus, housing society or street corner can see its own air quality instead of relying on a distant city station. The builder note from this build is practical: the PMS5003 fan inlet must face clear, unobstructed air and the MQ-135 needs a warm-up period before its readings settle, so the firmware discards the warm-up readings and labels the MQ-135 output as a relative gas index rather than a calibrated gas concentration. That distinction is what keeps the display honest.
| AQI category | AQI range | What the display means |
| Good | 0–50 | Air quality is satisfactory for outdoor activity |
| Moderate | 51–100 | Acceptable, with a caution for unusually sensitive people |
| Unhealthy for Sensitive Groups | 101–150 | Sensitive groups should shorten prolonged outdoor exertion |
| Unhealthy | 151–200 | Everyone may begin to feel effects; sensitive groups should avoid prolonged exertion |
| Very Unhealthy | 201–300 | Health alert; avoid outdoor exertion |
| Hazardous | 301–500 | Emergency conditions; avoid going outdoors |
The Problem
Outdoor air pollution is hard to act on because it cannot be seen clearly and because city-wide readings rarely describe one street, campus gate or housing society. Anyone wanting to know whether the air outside their own building is safe today usually finds only a distant station, yesterday's average, or a city-wide phone app. That gap matters because particle levels change with traffic peaks, construction dust, festival smoke and wind, and a single daily figure hides the morning and evening surges that people actually breathe through. The IoT-based outdoor air pollution monitor in this project closes that gap at one location: it samples the air continuously at the spot where it is installed, converts particle readings into a live Air Quality Index, and shows that index on an outdoor display and a cloud dashboard. For a final-year build it demonstrates sensor interfacing, embedded firmware, wireless data upload and public-facing data presentation in one complete system.
How it works
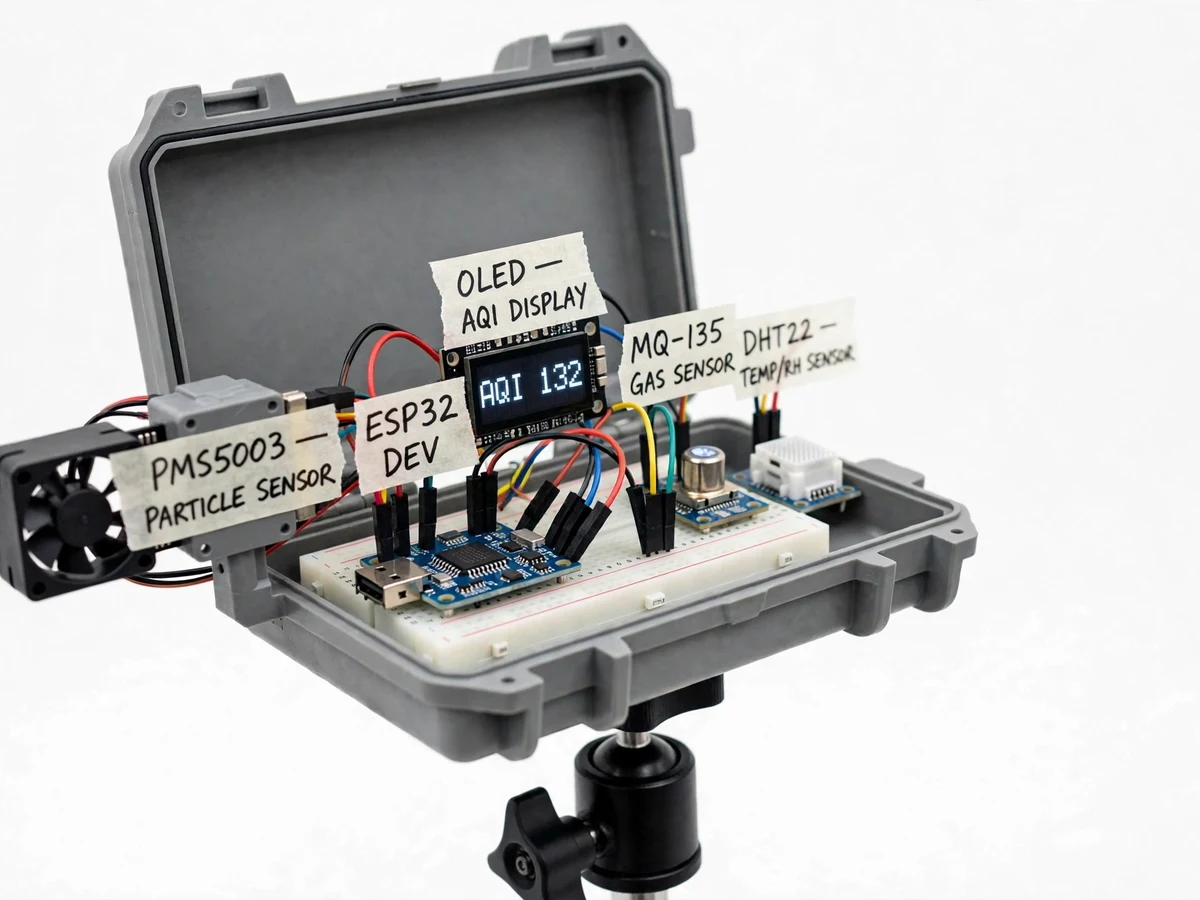
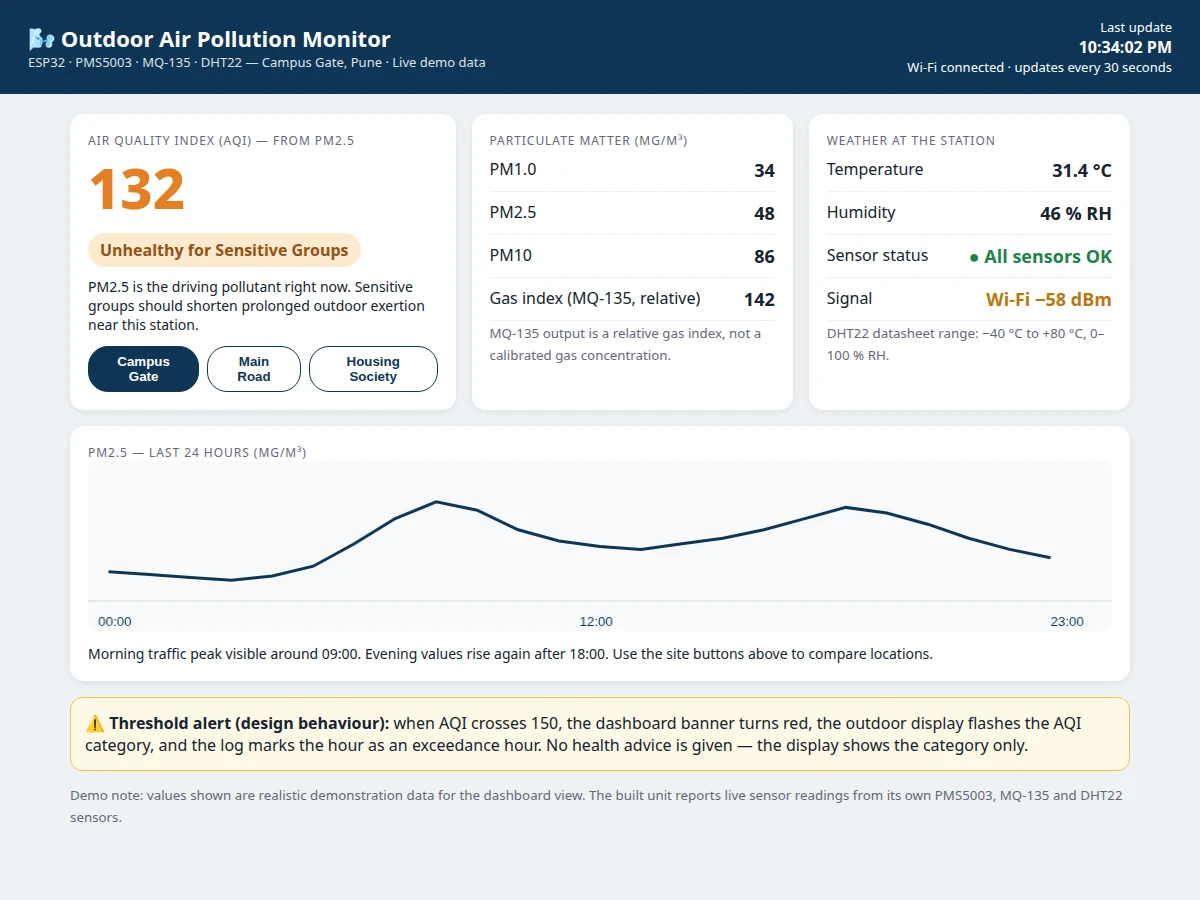
The IoT-based outdoor air pollution monitor works as one continuous chain from the air outside to the screen a reader sees. The PMS5003 fan pulls outdoor air through a laser beam, and particles crossing that beam scatter light onto a photodiode; the sensor counts those pulses by size, sorts them into size bins, and converts the counts into PM1.0, PM2.5 and PM10 mass concentrations. The ESP32 reads those concentrations together with the MQ-135 gas signal and the DHT22 temperature and humidity, discards the MQ-135 warm-up readings, computes the AQI from the PM2.5 value, and writes the result to the outdoor OLED display. The same reading is then sent over Wi-Fi to the cloud dashboard, where it is stored, charted over 24 hours and compared across sites, and an alert is raised whenever the AQI crosses the configured threshold.
- The PMS5003 fan draws outdoor air through the sensor, where a laser beam scatters light off suspended particles and the sensor reports PM1.0, PM2.5 and PM10 concentrations.
- The MQ-135 gas sensor and DHT22 temperature-humidity sensor are read alongside the particle data, with warm-up readings discarded before logging.
- The ESP32 computes the AQI from the PM2.5 value and maps it to its category, from Good through Hazardous.
- The current AQI value and category appear on the outdoor OLED display in large, readable text.
- The full reading is uploaded over Wi-Fi to the cloud dashboard at the configured interval of 30 seconds (design target).
- The dashboard stores each reading, draws the 24-hour PM2.5 chart and lets the user compare sites.
- When the AQI crosses the configured threshold of 150, the dashboard banner changes and the hour is marked as an exceedance hour in the log.
Tech stack:
- ESP32 microcontroller with Wi-Fi
- PMS5003 laser particle sensor
- MQ-135 gas sensor module
- DHT22 temperature and humidity sensor
- OLED display for local AQI readout
- Arduino IDE firmware in C/C++
- Cloud dashboard with Wi-Fi data upload
- Weatherproof enclosure with pole or wall mounting
| Parameter | Value |
|---|---|
| Controller | ESP32 with built-in Wi-Fi (datasheet value: dual-core microcontroller) |
| Particle sensor | PMS5003 laser-scattering sensor (datasheet value) |
| Minimum distinguishable particle diameter | 0.3 micrometres (datasheet value) |
| Particle size bins | 0.3–1.0 micrometres, 1.0–2.5 micrometres and 2.5–10 micrometres (datasheet value) |
| PM2.5 effective measurement range | 0–500 micrograms per cubic metre (datasheet value) |
| PM2.5 resolution | 1 microgram per cubic metre (datasheet value) |
| Gas sensor | MQ-135 module, relative gas index only (not a calibrated concentration) |
| Temperature range | −40 °C to +80 °C (DHT22 datasheet value) |
| Humidity range | 0–100 % RH (DHT22 datasheet value) |
| Temperature accuracy | ±0.5 °C typical (DHT22 datasheet value) |
| Humidity accuracy | ±2 % RH typical, ±5 % RH maximum (DHT22 datasheet value) |
| Local display | OLED display showing AQI value and category |
| Data upload interval | 30 seconds (design target) |
| Power supply | 5 V DC adapter (design target) |
| Connectivity | Wi-Fi to cloud dashboard; local display works without cloud upload |
| Mounting | Pole or wall bracket with weatherproof enclosure (design target) |
Project features
The IoT-based outdoor air pollution monitor in this project combines four capabilities that matter most for an outdoor station: continuous particle measurement, a readable outdoor AQI display, a cloud dashboard with history, and threshold alerts that mark poor-air hours. Particle sensing covers PM1.0, PM2.5 and PM10 from a single laser-scattering sensor, so the display can show both fine and coarse dust. The gas sensor adds a relative indicator of smoke and fumes, while temperature and humidity readings help explain why particle readings move between dry and humid days. Together these capabilities turn a sensor board on a bench into a station that a campus or housing society can actually read, compare across days, and discuss in a viva with real behaviour to explain. The enclosure, display and dashboard are designed together, so the same reading is visible on the street, on a phone, and in the stored history without any manual copying.
- [Continuous PM1.0, PM2.5 and PM10 measurement] The PMS5003 laser-scattering sensor draws air with a small fan, counts particles in size bins and reports mass concentrations for PM1.0, PM2.5 and PM10, giving the three particle figures the AQI calculation needs.
- [Live outdoor AQI display] An OLED display on the unit shows the current AQI value and its category in large text, so passers-by can read the air quality without opening any app.
- [Cloud dashboard with history] Readings are uploaded over Wi-Fi to a dashboard that shows current values, a 24-hour PM2.5 chart and per-site comparison, so trends and traffic peaks stay visible after the moment passes.
- [Threshold alerts and exceedance log] When the AQI crosses the configured threshold of 150, the dashboard banner changes, the display flags the category, and the hour is marked as an exceedance hour in the log.
- [Temperature and humidity context] The DHT22 sensor records temperature and humidity beside every particle reading, helping the student explain humidity-related drift in particle figures during the viva.
- [Relative gas-level indicator] The MQ-135 sensor provides a relative gas index for smoke and fume events; it is labelled as a relative index on the dashboard, never as a calibrated gas concentration.
- [Weatherproof field enclosure] The electronics sit in a lidded enclosure with the particle sensor inlet facing clear air, so the unit can be mounted outdoors on a pole or wall bracket.
What is included
- Working weatherproof outdoor monitor unit with ESP32, PMS5003, MQ-135, DHT22 and OLED display
- Complete firmware source code with AQI calculation and Wi-Fi upload
- Cloud dashboard view with current readings, 24-hour chart and exceedance log
- Circuit and wiring documentation with component list
- Setup and mounting instructions for outdoor installation
- Project abstract PDF
- Project report documentation
- Demonstration guidance and viva Q&A preparation
To request a quotation, message Projectech on WhatsApp with the project name, the scope you want (the base outdoor monitor unit, or the base unit plus extra dashboard sites), and your delivery date; Projectech replies with a quotation covering scope, price, and delivery timeline.
Limitations & prerequisites
- The unit is an academic prototype, not a certified reference air-quality station, and its readings must not be presented as regulatory measurements.
- The MQ-135 output is a relative gas index only; it does not give a calibrated concentration in parts per million for any specific gas.
- Low-cost particle sensors drift with humidity and with very high dust loads, so readings are indicative and need periodic comparison against a reference where accuracy matters.
- Wi-Fi upload needs a reachable network at the installation spot; without Wi-Fi the local OLED display still works but the dashboard stops updating.
- The PMS5003 fan inlet must face clear air; a blocked, sheltered or rain-exposed inlet gives misleading readings.
- Outdoor power needs a weather-protected 5 V DC supply at the mounting point; battery-only operation is not part of the base unit.
- AQI categories shown follow the standard 0–500 scale bands; local authority bands may differ and should be checked before public display.
Frequently Asked Questions
Is this project suitable for a final-year project?
Yes, directly: it suits Electronics, IoT and Electrical final-year students because it combines sensor interfacing, embedded firmware, wireless communication and data presentation in one demonstrable system. The viva story is strong because the student can explain laser scattering, AQI calculation, Wi-Fi upload and the honest limits of low-cost sensors from one build.
Which controller and sensors are used?
The ESP32 is the controller, chosen for built-in Wi-Fi, and it reads three sensors plus a display. Particle measurement uses the PMS5003 laser-scattering sensor, gas indication uses the MQ-135 module, temperature and humidity use the DHT22 sensor, and an OLED display shows the local AQI readout.
Does it work without internet?
Partly: the outdoor OLED display keeps showing the live AQI without any connection, since the ESP32 computes it locally. The cloud dashboard, history chart and exceedance log need Wi-Fi, so those parts pause while the network is down and resume when it returns.
Is the MQ-135 reading a real gas concentration?
No, and the dashboard says so plainly: the MQ-135 gives a relative gas index that rises with smoke and fumes, not a calibrated parts-per-million value for one gas. That honesty matters in the viva, and a calibrated gas analyser would be a separate, costlier instrument.
Can it be customized?
Yes, within realistic limits: extra sites can be added to the dashboard, the alert threshold can be changed in firmware, a rain shield or solar-assisted supply can be discussed for the enclosure, and additional sensors can be added where the ESP32 has free interfaces and the power budget allows.
What will I receive with the project?
You receive the working weatherproof monitor unit, firmware source code, cloud dashboard view, circuit and wiring documentation, component list, setup and mounting instructions, abstract PDF, project report and demonstration guidance. Everything is prepared fresh for your order, not taken from an earlier student's build.
Components & software requirements
- ESP32 microcontroller with Wi-Fi
- PMS5003 laser particle sensor
- MQ-135 gas sensor module
- DHT22 temperature and humidity sensor
- OLED display for local AQI readout
- Arduino IDE firmware in C/C++
- Cloud dashboard with Wi-Fi data upload
- Weatherproof enclosure with pole or wall mounting
Delivery information
Built-to-order project. Delivery timeline is shared after order confirmation based on current queue.
Support terms
Complete documentation, setup guide, and viva preparation included. Support for setup and explanation provided.
Download free synopsis (PDF)
Enter your name and WhatsApp number — the synopsis PDF downloads immediately. We may send occasional project updates on WhatsApp; no spam.