
More project photos (2)

The problem
A poultry shed lives or dies on its air. When temperature climbs past a bird's comfort band, chickens eat less, pant, and stop gaining weight; when ammonia from the litter builds up, respiratory stress quietly follows and mortality rises. Farmers usually discover both problems the slow way — by walking the shed, by smell, by watching birds gasp. This project replaces guesswork with continuous sensing: a single ESP32 node carrying a DHT22 for temperature and humidity, an MQ-137 for ammonia, and a light sensor for photoperiod tracking, reporting to a shed dashboard that judges every reading against bird-comfort bands rather than raw numbers. Crossing a warning band raises a visible dashboard alert; crossing the heat-stress line fires the buzzer and switches the exhaust fan on automatically. It is livestock-welfare engineering first and an IoT data system second.
How it works
- The ESP32 samples the DHT22 (temperature/humidity), MQ-137 (ammonia) and LDR light sensor on a fixed cycle; readings are filtered and converted to engineering units in firmware.
- Firmware compares each reading against its comfort band (stored, configurable constants) — in-band, warning band, or alarm band — every cycle.
- Entering a warning band flags WATCH on the dashboard and logs the event; entering the heat-stress or ammonia alarm band sounds the local buzzer and starts the exhaust fan.
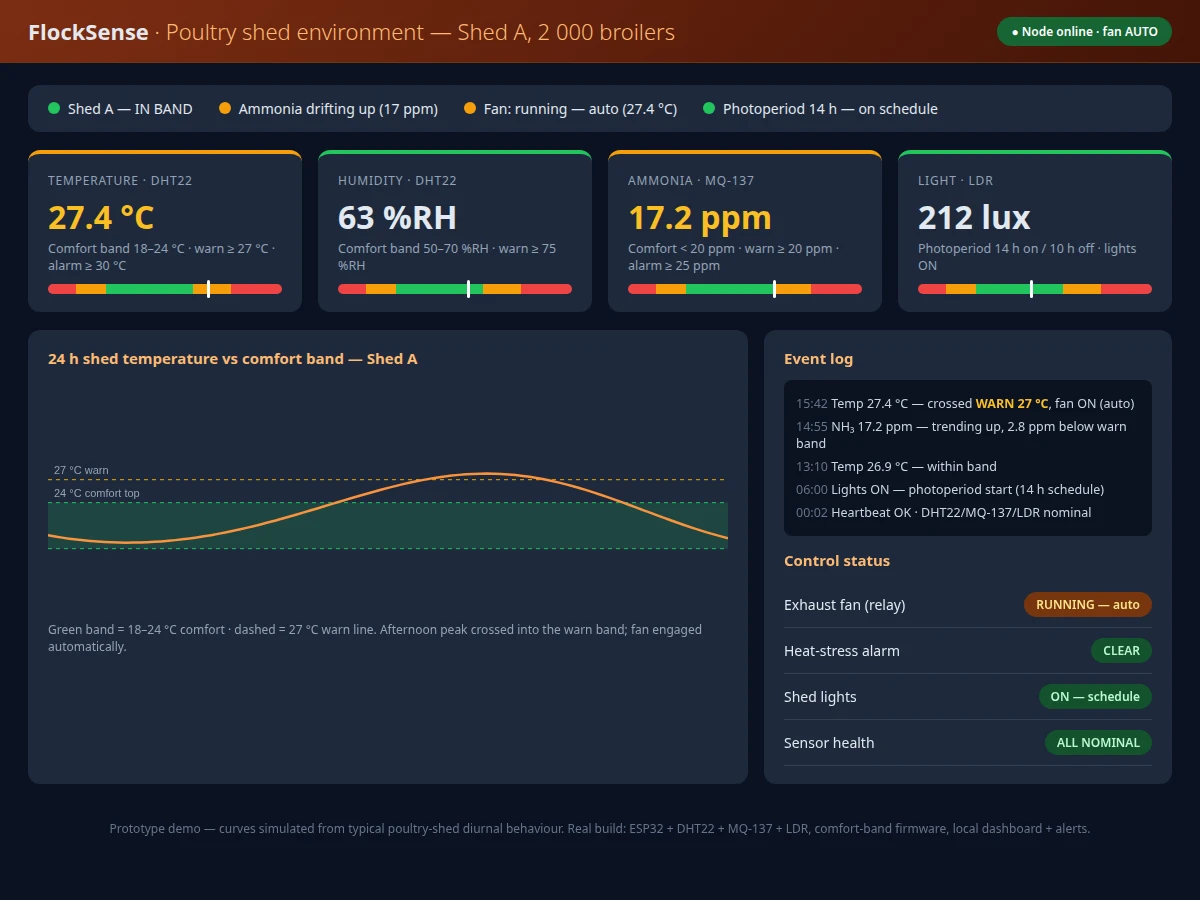
- Readings are pushed to the shed dashboard over Wi-Fi, where the gauge needles, the 24-hour comfort-band chart and the event log update live.
- The light sensor accumulates on/off hours against the configured photoperiod schedule; deviations appear as schedule-fault entries.
- Heartbeats carrying sensor status confirm the node is alive; a missed heartbeat raises a communication-fault entry instead of silently freezing the dashboard.
Tech stack:
- ESP32 development board
- DHT22 temperature-humidity sensor
- MQ-137 ammonia gas sensor module
- LDR light sensor module
- Relay module + 5 V exhaust fan
- Active buzzer (heat-stress alarm)
- Wi-Fi uplink to shed dashboard
- Comfort-band dashboard (HTML/CSS/JS single-file demo)
- Arduino IDE firmware
| Parameter | Value |
|---|---|
| Controller | ESP32 dev board (datasheet) |
| Temperature sensing | DHT22, -40 to 80 °C, ±0.5 °C (datasheet) |
| Humidity sensing | DHT22, 0–100 %RH, ±2–5 %RH (datasheet) |
| Ammonia sensing | MQ-137, 5–500 ppm NH3 range (datasheet), burn-in required |
| Light sensing | LDR module, lux-indicative (approximate) |
| Comfort band (default) | 18–24 °C · 50–70 %RH · <20 ppm NH3 (design, configurable per bird type) |
| Heat-stress alarm | ≥30 °C default (design, configurable) |
| Fan control | Relay, hysteresis ±1 °C around setpoint (design) |
| Sampling | Fixed cycle with per-cycle band check (design) |
| Uplink | Wi-Fi to shed dashboard (design) |
Project features
- [Comfort-band firmware logic] Temperature, humidity and ammonia are judged against configurable comfort bands (e.g. 18–24 °C, 50–70 %RH, <20 ppm NH3 as design defaults), with warning and alarm tiers so the dashboard shows WATCH before it shows ALARM.
- [Heat-stress alerting] Temperature breaching the alarm line fires a local buzzer and raises a heat-stress event with the exact reading and time — the demo shows how the alert chain looks end to end.
- [Automatic exhaust-fan control] A relay module drives the shed exhaust fan when temperature crosses the fan-on threshold, with hysteresis so the fan does not chatter around the setpoint.
- [Ammonia monitoring with MQ-137] The ammonia-specific SnO2 sensor tracks shed NH3 continuously; readings crossing the warn/alarm thresholds are logged with the action taken.
- [Photoperiod tracking] The light sensor records day/night hours against the configured lighting schedule (layers need consistent photoperiods), flagging deviations on the dashboard.
- [Live comfort-band dashboard] One screen shows all four gauges with band indicators, the 24-hour temperature curve drawn against the comfort band, the event log and control status.
- [Sensor health and heartbeat] The node reports sensor status and heartbeat periodically, so a disconnected DHT22 or an unheated MQ-137 reads as a fault, never as clean data.
- [Calibration and band-tuning guide] Procedures for MQ-137 burn-in, load-resistor tuning and adapting the comfort bands to the bird type (broiler vs layer, chick vs grower) are documented.
What is included
- Fully wired ESP32 sensor node (DHT22, MQ-137, LDR, relay, fan, buzzer, 5 V supply)
- Arduino firmware (sampling, comfort-band logic, fan control, buzzer alarm, Wi-Fi uplink, heartbeat)
- Comfort-band dashboard matching the demo: gauges, 24 h comfort-band chart, event log, control status
- Sensor calibration and comfort-band tuning procedure (MQ-137 burn-in, bird-type band tables)
- Shed mounting guide (node placement height, sensor exposure, fan positioning)
- Complete wiring diagram and schematic
- Project report PDF (background, poultry environment science, sensor theory, methodology, observations)
- PPT presentation for final review
- Viva Q&A preparation document (comfort bands, heat stress, MQ sensor principles, hysteresis, photoperiod, calibration)
Limitations & prerequisites
- MQ-137 needs 24–48 h burn-in and periodic recalibration; ammonia readings are indicative comfort bands, not laboratory-grade measurements — the procedure is part of the deliverable.
- DHT22 humidity accuracy drifts at sustained high humidity (>90 %RH); readings at the extremes are approximate.
- Comfort bands are design defaults for general broiler/layer guidance — they must be adapted to the actual bird type and age, and the tuning guide explains how.
- The system warns and ventilates; it does not replace shed management practices (litter management, stocking density) that control ammonia at source.
- Wi-Fi must reach the shed; the local buzzer and fan work offline, but the dashboard does not log during an uplink outage.
Frequently Asked Questions
Why these three sensors?
Temperature and humidity define the bird's comfort band directly, ammonia (NH3) is the dominant respiratory stressor from litter, and photoperiod tracking matters for layer lighting schedules. Together they cover the shed's air, not just its temperature.
What happens on heat stress?
When temperature crosses the alarm line, the node sounds the local buzzer, starts the exhaust fan automatically and logs a heat-stress event with the reading and time — all of it visible in the demo dashboard.
How accurate is the ammonia reading?
Indicative, not metrology-grade: the MQ-137 needs burn-in, drifts with humidity and responds to some other gases. The project treats it honestly — burn-in, load-resistor calibration, conservative bands and documented limits in the report.
Can the comfort bands change for chicks vs layers?
Yes — the bands are firmware constants, not hardcoded hardware. The tuning guide includes band tables for broiler growers, layers and day-old chicks (which need ~32–35 °C, not 18–24 °C).
Does the fan work if Wi-Fi drops?
Yes. Fan control and the buzzer run in firmware on the node, independent of the uplink. The dashboard shows a communication fault during the outage instead of freezing on stale readings.
Is this project suitable for a final-year project?
Yes — for IoT & Embedded Systems, Electronics and Electrical programs. It combines real sensor interfacing, threshold/hysteresis control logic, a purpose-built dashboard and a genuine livestock-welfare application. Suitable for B.E./B.Tech final-year projects in IoT & Embedded Systems, Electronics and Electrical engineering.
Components & software requirements
- ESP32 development board
- DHT22 temperature-humidity sensor
- MQ-137 ammonia gas sensor module
- LDR light sensor module
- Relay module + 5 V exhaust fan
- Active buzzer (heat-stress alarm)
- Wi-Fi uplink to shed dashboard
- Comfort-band dashboard (HTML/CSS/JS single-file demo)
- Arduino IDE firmware
Delivery information
Built-to-order project. Delivery timeline is shared after order confirmation based on current queue.
Support terms
Complete documentation, setup guide, and viva preparation included. Support for setup and explanation provided.