
More project photos (2)
The problem
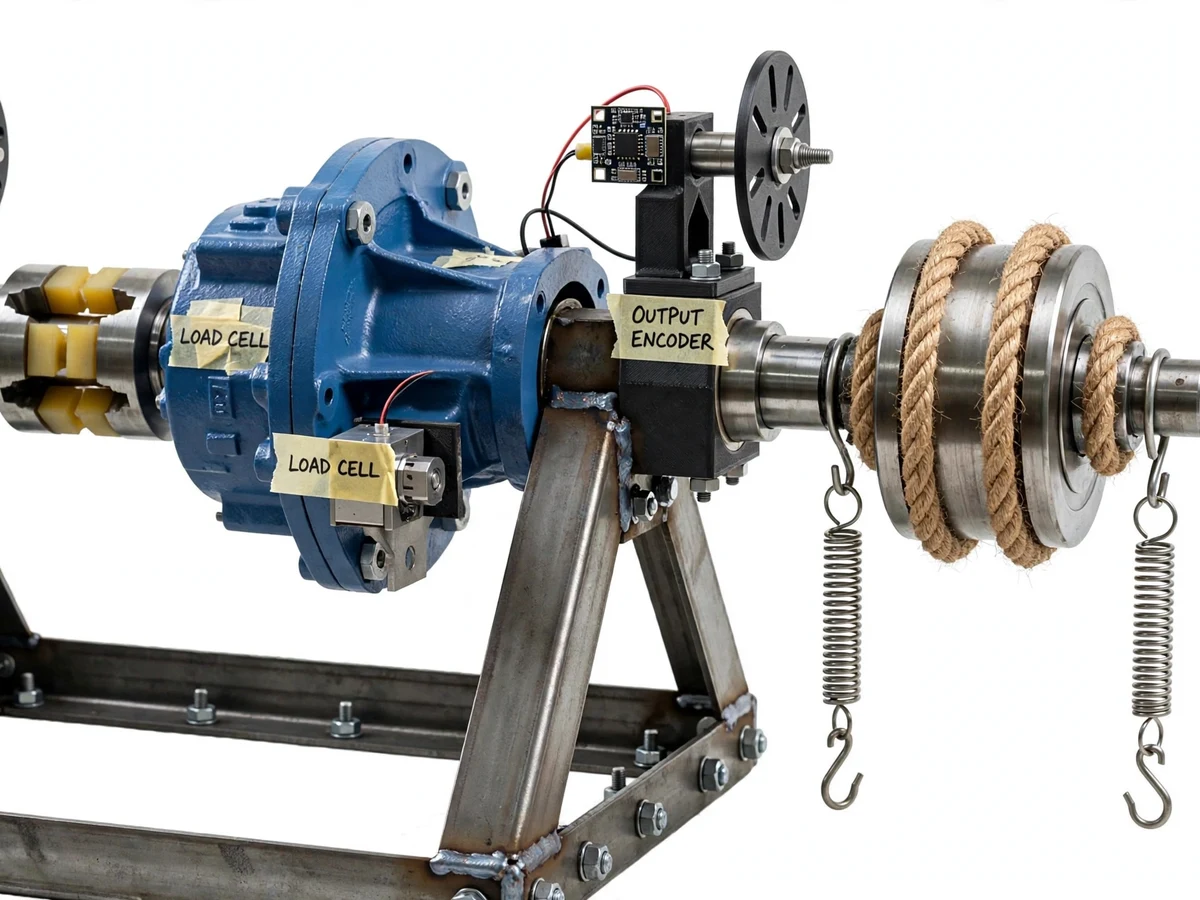
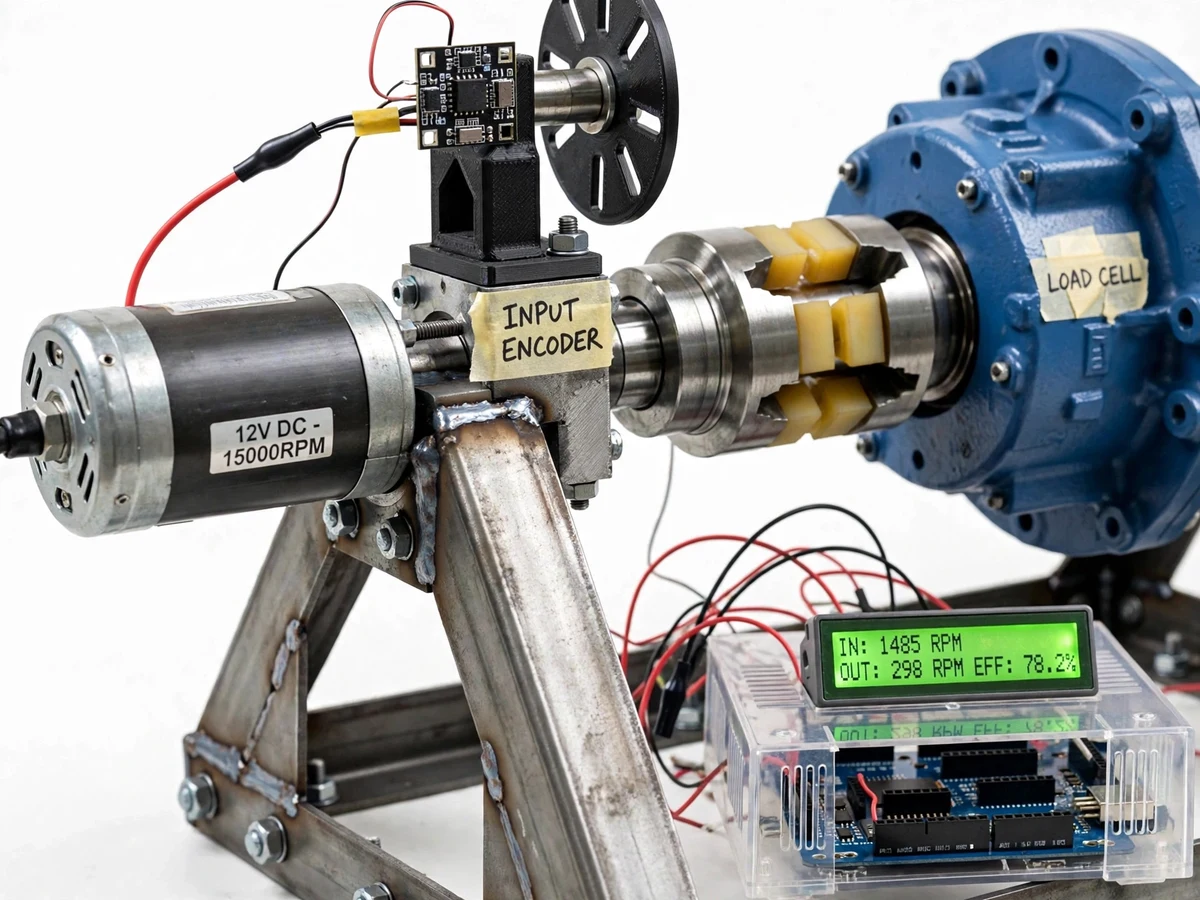
A gearbox datasheet states a ratio and a rated torque, but neither tells you how much power the unit actually wastes — gear mesh friction, bearing drag and seal losses all eat into the output, and textbook efficiency figures are estimates, not measurements. The classic mechanical-engineering answer is a brake dynamometer: drive the input at a known speed and torque, load the output with a measurable brake, and the efficiency follows directly from the power ratio. This project turns that classic experiment into a student-built rig: a 12V DC motor drives a two-stage spur gear reducer through a flexible jaw coupling, the output shaft is loaded by a rope brake dynamometer (rope wrapped on a steel drum, tension read on two spring scales), reaction torque is sensed with S-type load cells, and slotted-disc encoders on both shafts read input and output speed. An Arduino Uno computes efficiency live and displays input/output RPM, torques and efficiency on a 16x2 LCD, while logging readings over serial for the efficiency-versus-load curve. A separate dial-indicator procedure measures gear backlash with the output clamped.
This is a built-to-order hardware project: the fabricated rig, instrumented sensors, commented firmware, fabrication drawings and the complete viva kit (report, PPT, Q&A) are prepared fresh for you.
The problem
Gearbox efficiency is taught with a formula — η = (T_out · N_out) / (T_in · N_in) — but students almost never measure it, because commercial dynamometer rigs are industrial machines far beyond a college budget and departmental rigs, where they exist, are demonstration-only with pre-printed results. The project addresses this gap with a rig the student builds, calibrates and operates: torque and speed on both shafts are sensed, the brake load is stepped by hand, and every point on the efficiency curve is a reading the student took. That makes it a genuine machine-design + instrumentation + experimental study: the mechanical build (frame, couplings, brake drum), the sensor calibration (load-cell zero/span with known weights), and the analysis (efficiency curve against a textbook estimate) are all the student's own work.
Drives the gearbox input shaft through a flexible jaw coupling; speed set in PWM steps.
Follow the working sequence
How it works
- A 12V DC motor drives the gearbox input shaft through a flexible jaw coupling; firmware sets the input speed in PWM steps, and the input slotted-disc encoder (20 slots, design) counts pulses to give input RPM.
- A reaction S-type load cell (5 kg class, design) resists the gearbox housing rotation through a lever arm, and the HX711-amplified reading multiplied by the arm length gives input torque — calibrated by the student with known weights.
- The output shaft carries a steel brake drum (design approximately 150 mm diameter); a cotton rope wrapped twice around the drum carries a spring scale at each end, and the tension difference times the drum radius gives output torque.
- A second slotted-disc encoder on the output shaft gives output RPM; both pulse counts are interrupt-driven in the Arduino firmware so speed and torque stay in sync.
- The firmware computes input power, output power and efficiency η = (T_out · N_out) / (T_in · N_in), updates the 16x2 LCD with IN/OUT RPM, torques and efficiency percentage, and streams timestamped CSV rows over serial for spreadsheet plotting.
- The student steps the brake load (increasing rope tension), records steady-state efficiency at each load point, and plots the efficiency-versus-load curve against the textbook estimate; backlash is measured separately by clamping the output and rotating the input against a dial indicator.
Tech stack:
- Two-stage spur gear reducer (nominal 5:1, nameplate-verified at build)
- 12V DC motor with flexible jaw coupling
- Rope brake dynamometer: steel drum (design approximately 150 mm dia), rope, 2 spring scales
- S-type load cells (5 kg class, design) with HX711 amplifier modules
- Slotted-disc encoders (20 slots, design) with opto-interrupters, interrupt-driven firmware
- Arduino Uno (ATmega328P) with 16x2 character LCD
- Dial indicator (backlash procedure)
- Welded steel angle frame with dimensioned fabrication drawings
- Arduino IDE (C/C++ firmware)
| Parameter | Value |
|---|---|
| Gearbox | Two-stage spur gear reducer, nominal 5:1 ratio (nameplate value on the unit; verified at build) |
| Input drive | 12V DC motor through flexible jaw coupling, firmware PWM speed steps |
| Brake drum | Steel, design approximately 150 mm diameter |
| Brake | Rope brake (prony brake), cotton/hemp rope, two wraps, tension read on spring scales |
| Torque sensing | S-type load cells, 5 kg class (design), HX711 amplification, buyer-calibrated with known weights |
| Speed sensing | Slotted-disc encoders, 20 slots (design), opto-interrupters, interrupt-driven pulse counting |
| Controller | Arduino Uno (ATmega328P, 16 MHz) |
| Display | 16x2 character LCD: input/output RPM, torques, efficiency |
| Data logging | Timestamped CSV rows over USB serial for spreadsheet plotting |
| Expected efficiency | Typically 75–82% for this class of two-stage spur reducer (textbook range, not a measured claim) |
| Efficiency accuracy | Design target: measured efficiency within ±2% of the textbook estimate after buyer calibration |
| Backlash | Dial-indicator procedure, output clamped, input rotated; measured by the student per build |
| Power | 12V DC regulated adapter, design approximately 3–5 A |
| Frame | Welded steel angle frame with dimensioned fabrication drawings |
Project features
- [Live efficiency computation] The Arduino calculates input/output power and efficiency from torque × RPM on both shafts and shows them live on the 16x2 LCD — no post-processing needed for a demonstration.
- [Rope brake dynamometer] A student-assembled prony-brake arrangement: rope wrapped on the steel output drum, tension read on two spring scales; output torque = tension difference × drum radius.
- [Load-cell torque sensing] S-type load cells with HX711 amplifiers sense reaction torque on the input side, giving the Arduino a true torque signal instead of a motor-current estimate.
- [Dual speed encoders] Slotted-disc encoders with opto-interrupters on input and output shafts count pulses in interrupt service routines for synchronized speed measurement.
- [Serial data logging] Timestamped CSV rows over the USB serial port feed straight into a spreadsheet for the efficiency-versus-load curve — the experimental core of the report.
- [Backlash measurement procedure] A step-by-step dial-indicator procedure with the output shaft clamped measures gear backlash, completing the rig's mechanical evaluation.
- [Configurable load and speed] Brake load is stepped by hand through rope tension (turnbuckles/spring scales), and input speed is set in firmware PWM steps — the student owns the full test matrix.
- [Buyer-run calibration procedure] A documented procedure uses known weights for load-cell zero/span and a pulse-count check for the encoders, so the calibration — and the numbers in the report — are genuinely the student's work.
What is included
- Working fabricated test rig: steel angle frame, two-stage spur gear reducer (nominal 5:1 ratio — nameplate verified at build), 12V DC motor with flexible jaw coupling, steel brake drum with rope and two spring scales, S-type load cells with HX711 modules, slotted-disc encoders with opto sensors, Arduino Uno with 16x2 LCD in an electronics enclosure
- Commented Arduino firmware (encoder interrupts, HX711 reading, efficiency computation, LCD + serial logging)
- Dimensioned frame fabrication drawings and a wiring diagram with exact part numbers
- Buyer-run calibration procedure (load-cell zero/span with known weights, encoder pulse-count check)
- Efficiency-versus-load and backlash calculation templates (spreadsheet)
- Project report PDF (transmission theory, dynamometer principle, design, methodology, test procedure)
- PPT presentation for final review
- Viva Q&A preparation document (gear efficiency, prony brake, torque sensing, backlash, calibration)
Limitations & prerequisites
- A low-power teaching rig: input power is limited by the 12V DC motor (design tens of watts) — it is not an industrial dynamometer and cannot test full-size industrial gearboxes.
- The rope brake is hand-stepped, not closed-loop; rope friction drifts with temperature and humidity, so readings must be taken at steady state per the procedure — the build guide says how.
- Efficiency numbers are computed from the student's own calibration (design target: within ±2% of the textbook estimate for this reducer class), never certified or pre-measured at our end; the report documents the procedure and the achieved values honestly.
- Backlash is unit-dependent: the measured value belongs to the specific gearbox on the rig, not a general claim about the reducer type.
- The entire rig is low-voltage (12V DC regulated adapter, design approximately 3–5 A); no mains wiring appears on the student build.
- Not a substitute for a certified test laboratory — built for academic measurement, demonstration and the final-year report.
Frequently Asked Questions
How is efficiency actually computed on the rig?
From the power ratio η = (T_out × N_out) / (T_in × N_in). Input torque comes from the reaction load cell times its lever arm, input speed from the input encoder; output torque comes from the rope brake (spring-scale tension difference × drum radius), output speed from the output encoder. The Arduino computes both powers and efficiency live and shows them on the LCD.
Why a rope brake instead of a hydraulic or electric dynamometer?
A prony (rope) brake is the classic teaching-lab dynamometer: cheap to build, fully transparent (you can see the physics — tension difference times radius), and the math is examinable. Hydraulic and electric dynamometers belong on industrial test floors, not student budgets, and their workings are hidden inside.
Why are there both load cells and spring scales?
They measure different things. The S-type load cell with HX711 senses reaction torque on the input (drive) side electronically for the live firmware computation. The spring scales are the brake-load instrument on the output side — the load the student steps through the test matrix. Two independent measurement paths, and the report can cross-check them.
What does the backlash measurement add?
Efficiency tells you power loss; backlash tells you about gear mesh condition and assembly quality. Clamping the output and rotating the input against a dial indicator gives a real, measurable displacement the student records — a second mechanical parameter that turns a single experiment into a fuller evaluation.
What do I need to do myself when the rig arrives?
The included calibration procedure walks you through it: zero/span the load cells with known weights, verify the encoder pulse counts, and record the readings. Those calibration steps produce the numbers that go into your report — the whole point is that the measurements are yours.
Is this project suitable for a final-year project?
Yes — for Mechanical, Production and Manufacturing programs. It combines machine design (frame, couplings, brake drum), instrumentation (load cells, encoders, HX711, Arduino firmware), and a genuine experimental study with a student-measured efficiency curve and backlash readings for the report and viva. Suitable for B.E./B.Tech final-year projects in Mechanical, Production and Manufacturing Engineering.
Components & software requirements
- Two-stage spur gear reducer (nominal 5:1, nameplate-verified at build)
- 12V DC motor with flexible jaw coupling
- Rope brake dynamometer: steel drum (design approximately 150 mm dia), rope, 2 spring scales
- S-type load cells (5 kg class, design) with HX711 amplifier modules
- Slotted-disc encoders (20 slots, design) with opto-interrupters, interrupt-driven firmware
- Arduino Uno (ATmega328P) with 16x2 character LCD
- Dial indicator (backlash procedure)
- Welded steel angle frame with dimensioned fabrication drawings
- Arduino IDE (C/C++ firmware)
Delivery information
Built-to-order project. Delivery timeline is shared after order confirmation based on current queue.
Support terms
Complete documentation, setup guide, and viva preparation included. Support for setup and explanation provided.
Download free synopsis (PDF)
Enter your name and email — the synopsis PDF downloads immediately. We may send occasional project updates; no spam, unsubscribe anytime.