
More project photos (2)
The problem
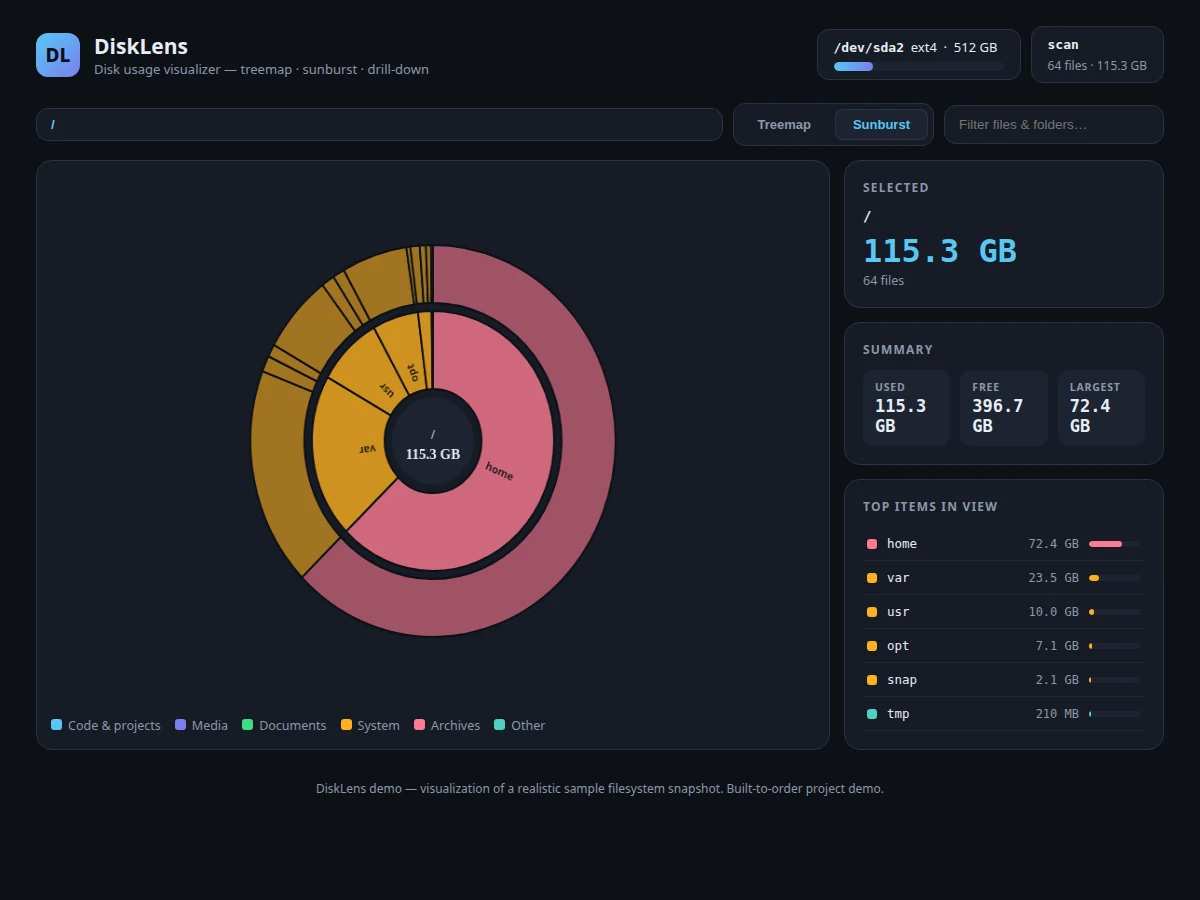
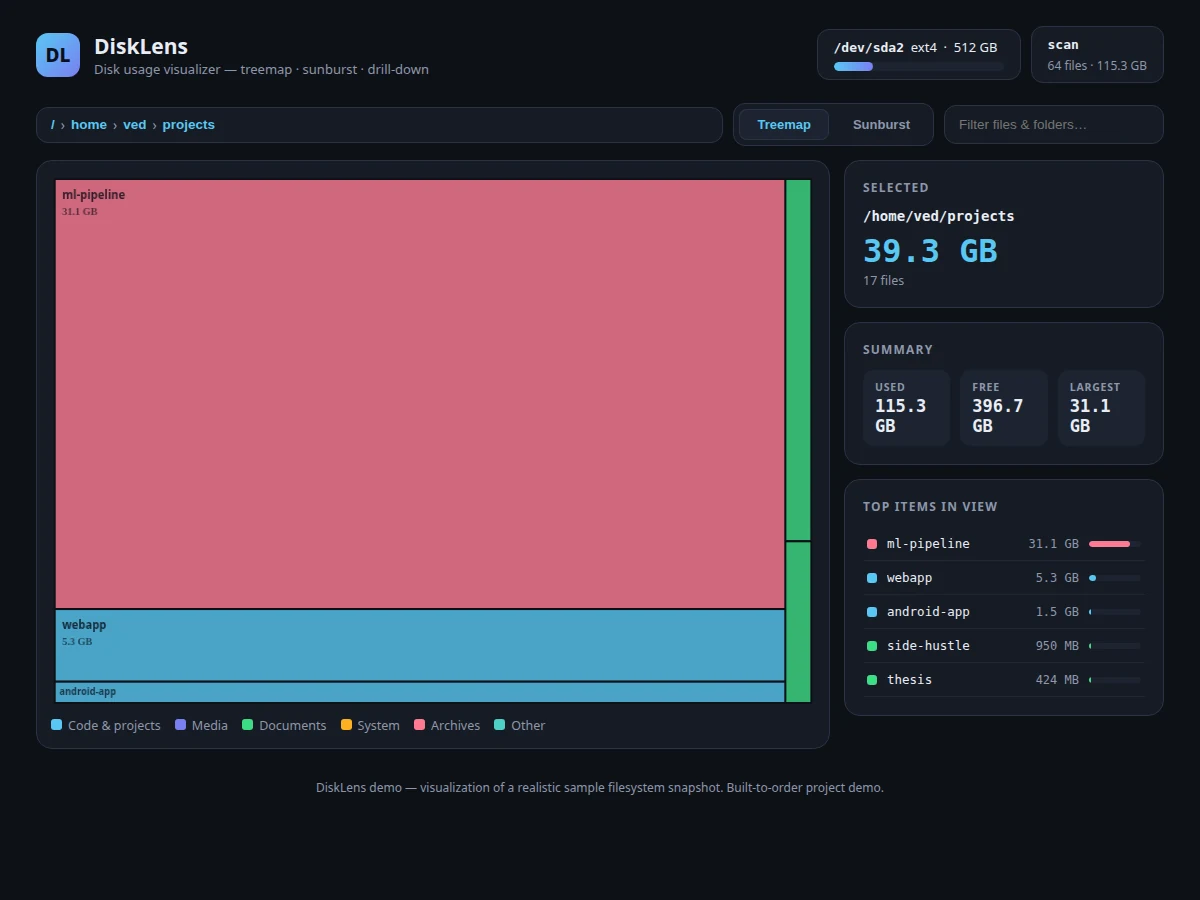
Disks fill up silently: a developer's machine accumulates Docker layers, node_modules folders, video renders and forgotten downloads until the operating system starts complaining. Built-in tools list folders by size in a flat table, which hides the structure — a 2 GB folder of videos looks identical to a 2 GB folder of source code. Area-based visualization solves this: a treemap makes each file and folder a rectangle sized by its bytes, so space hogs are visible at a glance, while a sunburst shows the same hierarchy radially. DiskLens implements both views in a single-file web app — a squarified treemap layout, a two-level sunburst chart, click-to-drill-down with breadcrumbs, live search filtering, hover tooltips and a per-folder analytics panel — demonstrating data-structure traversal, layout algorithms and canvas rendering in one build.
How it works
- A realistic filesystem snapshot is embedded as a nested JSON tree of folders, files, sizes and categories.
- A rollup pass computes each subtree's total size, file count and dominant category before rendering.
- The squarified treemap algorithm partitions the current folder's children into area-proportional rectangles; the sunburst maps the same sizes to arc angles across two rings.
- Canvas hit-testing drives hover tooltips (name, size, category) and click drill-down, which updates the breadcrumbs, the folder panel and the top-items list.
- Typing in the search box filters the tree by name; matching items are re-rendered live in both views.
- The selected-folder panel aggregates size, file count and the largest children for whatever level is open.
Tech stack:
- HTML5 canvas
- Vanilla JavaScript (ES6)
- Squarified treemap layout algorithm
- Canvas hit-testing for interaction
- JSON data model for the filesystem snapshot
- Single-file build, zero dependencies
| Parameter | Value |
|---|---|
| Delivery | Single HTML file, runs offline after download |
| Views | Treemap + two-level sunburst + drill-down detail |
| Layout algorithm | Squarified treemap (aspect-ratio optimized) |
| Categories | 6 (code, media, documents, system, archives, other) |
| Interactions | Hover tooltips, click drill-down, breadcrumbs, live search |
| Data model | Embedded JSON filesystem snapshot with size rollup |
| Browsers | Any modern browser (Chrome, Firefox, Edge) |
Project features
- [Squarified treemap] The layout algorithm partitions each folder into area-proportional rectangles with good aspect ratios, rendered to canvas — the largest space hogs are unmissable.
- [Sunburst chart] The same hierarchy drawn as radial arcs across two rings, with canvas hit-testing so arcs can be hovered and clicked like the treemap.
- [Drill-down navigation] Click any rectangle or arc to descend into that folder; breadcrumbs track the path and one click returns to any level.
- [Live search filter] Type to filter the tree across files and folders; the views re-render instantly around the matching items.
- [Per-folder analytics panel] The selected folder shows its total size, file count, dominant category and a ranked list of its largest children.
- [Top-items list] A global ranked list of the largest files and folders in the current view, clickable to jump straight to them.
- [Category color coding] Items are colored by category — code, media, documents, system, archives, other — with a legend, so composition is readable at a glance.
- [Scan animation] An opening scan sequence with progress readout sets up the analytics-dashboard feel before the views render.
What is included
- Working DiskLens web app (single HTML file)
- Complete commented source code
- User guide: views, navigation, search, extending the snapshot data
- Project report PDF (visualization theory, algorithm design, implementation)
- PPT presentation for final review
- Viva Q&A preparation document (treemaps, sunbursts, layout algorithms, canvas rendering)
Limitations & prerequisites
- Works on an embedded snapshot, not a live scan of the user's real disk — there is no companion scanner in this build.
- The sunburst renders two hierarchy levels; deeper levels are reached by drill-down.
- Snapshot editing (adding your own folders) requires editing the JSON data block by hand.
- No persistence: drill-down state resets on reload.
Frequently Asked Questions
Does it scan my real hard disk?
No — this build visualizes an embedded realistic snapshot, which keeps it a portable single-file demo. A live scanner is documented as future scope in the report.
What is a squarified treemap?
A treemap layout that keeps rectangles close to square so areas are easy to compare; the report walks through the algorithm step by step for the viva.
How do the two views stay in sync?
Both render from the same rolled-up tree and the same selection state, so drill-down, search and breadcrumbs update treemap and sunburst together.
Can I load my own folder data?
Yes — the snapshot is a documented JSON structure, and the user guide shows the schema for replacing it with your own data.
Is this project suitable for a final-year project?
Yes — for Computer Science and IT programs. It demonstrates hierarchical data structures, layout algorithms, canvas graphics and interactive UI design. Suitable for B.E./B.Tech final-year projects in Computer Science and IT.
Components & software requirements
- HTML5 canvas
- Vanilla JavaScript (ES6)
- Squarified treemap layout algorithm
- Canvas hit-testing for interaction
- JSON data model for the filesystem snapshot
- Single-file build, zero dependencies
Delivery information
Built-to-order project. Delivery timeline is shared after order confirmation based on current queue.
Support terms
Complete documentation, setup guide, and viva preparation included. Support for setup and explanation provided.