
More project photos (2)
The problem
When a server misbehaves, the first artifact anyone reaches for is the log file — and it is usually tens of thousands of lines long. Developers scroll, grep, and eyeball timestamps, a slow manual process that routinely misses the actual story: the same failure repeating 200 times in an hour, a disk filling up in the background, or a brute-force attack hiding among routine warnings. Cloud log platforms solve this, but they cost money, need the logs shipped off-site, and are overkill for a student, a small team, or anyone debugging a single machine.
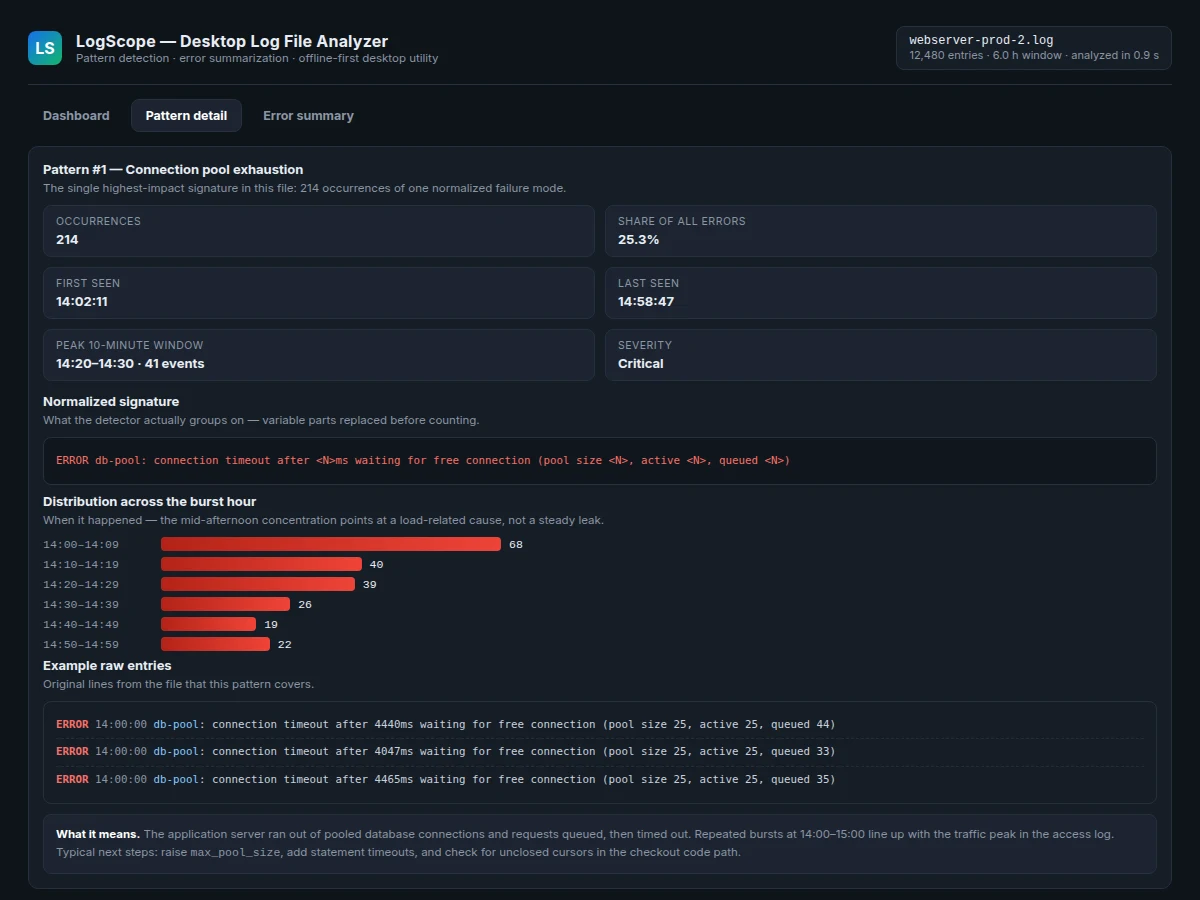
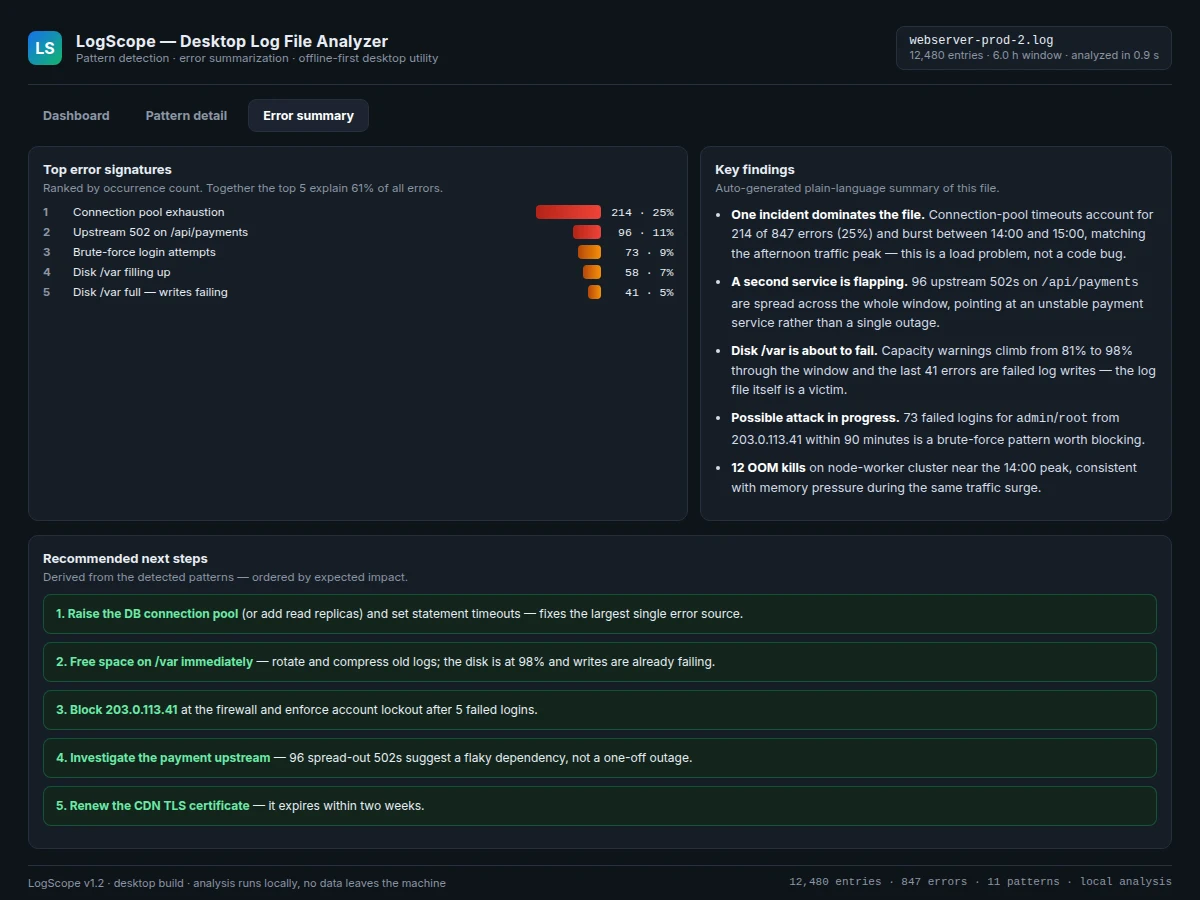
This project takes the opposite approach: a desktop utility that does the whole job locally, with no accounts, no servers and no data ever leaving the machine. LogScope parses common log formats, normalizes each line into a stable error signature, groups recurring patterns, detects bursts where one failure suddenly spikes, and writes a plain-language summary of what the file actually says — top error signatures, key findings, and recommended next steps — alongside an hourly timeline and a filterable viewer for the raw entries. It is deterministic pattern mining rather than black-box AI, which makes every result explainable in a viva: the student can point at the exact normalization rule behind each detected pattern.
Drops a log file onto the app and configures the pattern-detection occurrence threshold.
Follow the working sequence
How it works
- The user drops a log file onto the app; the format detector sniffs the first few hundred lines and picks the matching parser (access-log, syslog, or JSON).
- Each line is parsed into timestamp, severity, source and message, then stored in a local SQLite index for fast filtering.
- The normalizer strips variable parts (IPs, timestamps, IDs, durations, quoted strings) from every error and warning line to produce a stable signature.
- Identical signatures are grouped and counted; groups above a configurable occurrence threshold become detected patterns, ordered by impact.
- A sliding-window scan flags bursts: any pattern with a sharp concentration of events inside one window is marked as a burst incident.
- The summarizer ranks the top signatures, derives key findings (dominant incident, flapping dependency, resource exhaustion, attack-like repetition) and pairs each with a recommended next step.
- The UI renders the timeline chart, pattern list, findings and the filterable raw-entry viewer; the whole report can be exported to PDF or HTML.
Tech stack:
- Electron + Node.js (cross-platform desktop shell)
- SQLite (local log index, no server needed)
- Vanilla JavaScript + SVG (timeline charts, no chart library weight)
- reportlab-free PDF export via Chromium print pipeline
- Jest (unit tests for parser and normalizer)
| Parameter | Value |
|---|---|
| Log formats | Apache/Nginx access, syslog-style, JSON app logs (design target) |
| Max file size | Approximately 1 GB per file (design target) |
| Parse throughput | Approximately 40,000–60,000 lines/sec on a laptop CPU (expected) |
| Analysis time | Under 2 s for a 12,500-line file (design target) |
| Pattern method | Deterministic signature normalization + grouping (no ML in core build) |
| Burst window | 10-minute sliding window, configurable (design target) |
| Pattern threshold | Minimum 6 occurrences to register a pattern (configurable) |
| Supported OS | Windows 10+, macOS 12+, Ubuntu 20.04+ (design target) |
| Installer size | Approximately 85–110 MB (expected) |
| Report export | PDF and single-file HTML |
Project features
- [Multi-format log ingestion] Parses Apache/Nginx access logs, syslog-style lines and JSON application logs from a single drag-and-drop, with automatic format detection per file.
- [Signature-based pattern detection] Normalizes each line — IPs, timestamps, request IDs, durations and quoted strings replaced with placeholders — then groups identical failure modes and ranks them by occurrence count and severity.
- [Burst detection] Flags any signature that spikes inside a sliding time window, so a 200-occurrence pool-exhaustion incident reads as one incident, not 200 scattered lines.
- [Plain-language error summary] Generates top error signatures, key findings and recommended next steps from the detected patterns, written in readable sentences rather than raw statistics.
- [Timeline and severity views] Hourly error/warning volume chart plus per-pattern mini-distribution bars, making it obvious when an incident started and whether it is still growing.
- [Filterable log viewer] Severity chips and full-text search across message, source and IP, so any summarized claim can be verified against the raw entries in one click.
- [Exportable reports] One-click export of the summary, pattern table and timeline to PDF or HTML for attaching to incident notes or the project report.
Optional and future scope (clearly separated from the implemented build above)
- Optional: anomaly detection on event rate — an add-on module that flags hours whose error volume deviates sharply from the file's own baseline using z-score thresholds; not part of the core build.
- Future scope: ML-based log clustering — grouping free-text messages with TF-IDF and density clustering is documented as future scope, not implemented; the shipped build uses deterministic signature matching only.
What is included
- Complete Electron desktop application with installer builds for Windows, macOS and Linux
- Pattern-detection engine source (parser, normalizer, grouping, burst detection, summarizer)
- Realistic sample log dataset (multi-incident server log) used for the demo
- Exportable PDF/HTML report generator
- Project report PDF (background, log-analysis techniques, normalization design, methodology, results on the sample dataset)
- PPT presentation for final review
- Viva Q&A preparation document (log formats, regex parsing, signature normalization, burst detection, SQLite indexing)
Limitations & prerequisites
- Batch analysis of static files is the core workflow — live tailing of a growing log is future scope, not shipped.
- Pattern quality depends on log regularity; fully unstructured free-text logs with no repeated structure group poorly.
- The burst detector needs a minimum event density — a file with only a handful of errors yields a thin summary.
- Timestamps are assumed to be in one consistent format per file; mixed-format files need a preprocessing pass.
- All throughput and file-size figures are design targets stated honestly — the report documents measured numbers from the buyer's own test runs.
Frequently Asked Questions
Which log formats can it parse?
Apache and Nginx access logs, syslog-style lines (timestamp + level + source + message), and JSON application logs. The format detector inspects the first few hundred lines and selects the parser automatically; custom formats can be added by writing one small parser function.
How does pattern detection work without machine learning?
Each error or warning line is normalized — IPs, timestamps, IDs, durations and quoted strings are replaced with placeholders — so 200 occurrences of "connection timeout after 4440ms" collapse into one signature. Identical signatures are grouped and counted. It is deterministic, which means every detected pattern is fully explainable.
How large a log file can it handle?
The design target is around 1 GB per file with roughly 40,000–60,000 lines parsed per second on a laptop CPU. Lines stream into a local SQLite index, so memory stays flat regardless of file size.
Is the anomaly detection part of the build?
It is an optional add-on module that flags hours whose error volume deviates from the file's own baseline using z-score thresholds. ML-based clustering of free-text messages is documented as future scope and is not implemented.
Can it monitor logs in real time?
Not as shipped — the core workflow analyzes complete log files. Live tailing of a growing file is listed as future scope in the report, since it needs a different architecture (file watchers and incremental indexing).
Is this project suitable for a final-year project?
Yes — for Computer Science and IT programs. It combines file parsing, string processing, data structures, SQLite indexing and desktop application development into one coherent, demonstrable product with a real-world use case every interviewer recognizes.
Components & software requirements
- Electron + Node.js (cross-platform desktop shell)
- SQLite (local log index, no server needed)
- Vanilla JavaScript + SVG (timeline charts, no chart library weight)
- reportlab-free PDF export via Chromium print pipeline
- Jest (unit tests for parser and normalizer)
Delivery information
Built-to-order project. Delivery timeline is shared after order confirmation based on current queue.
Support terms
Complete documentation, setup guide, and viva preparation included. Support for setup and explanation provided.
Download free synopsis (PDF)
Enter your name and email — the synopsis PDF downloads immediately. We may send occasional project updates; no spam, unsubscribe anytime.