
More project photos (2)
The problem
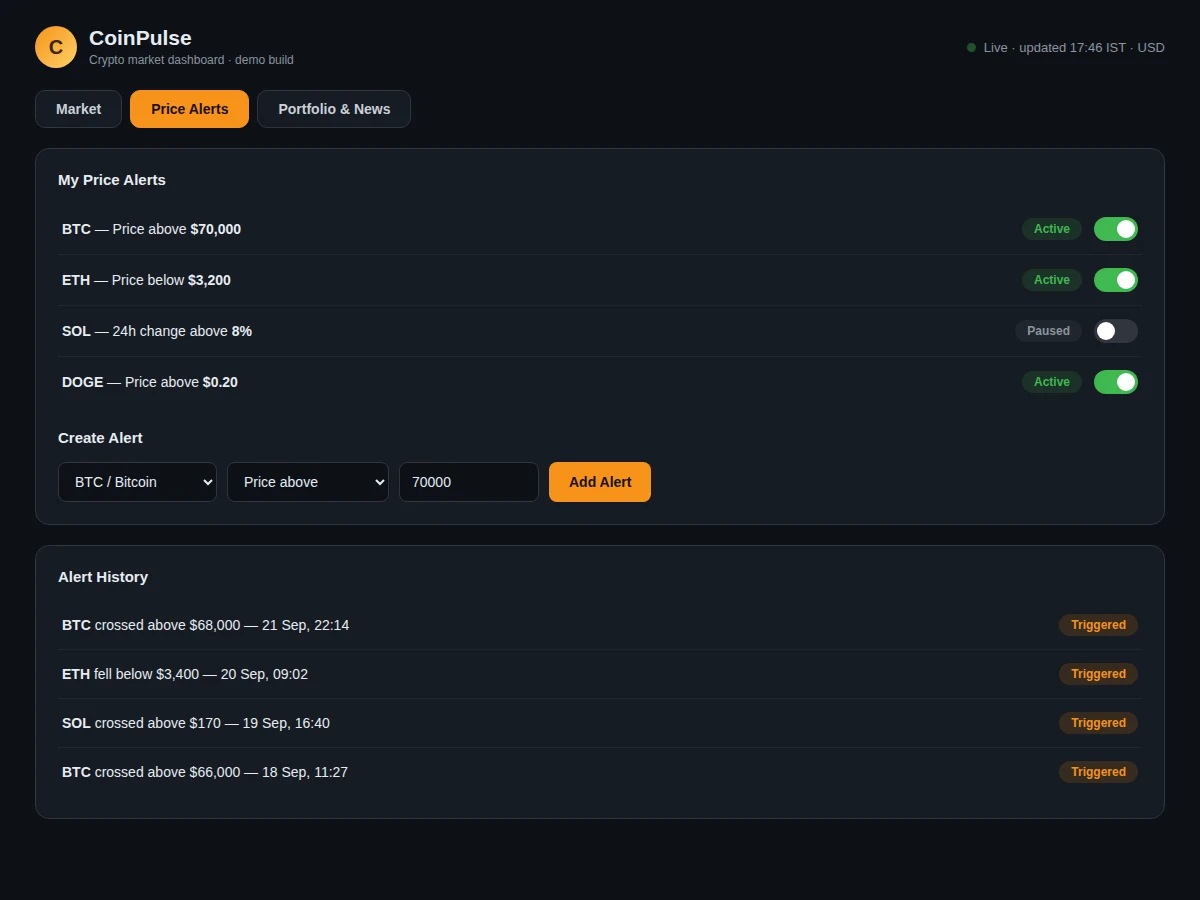
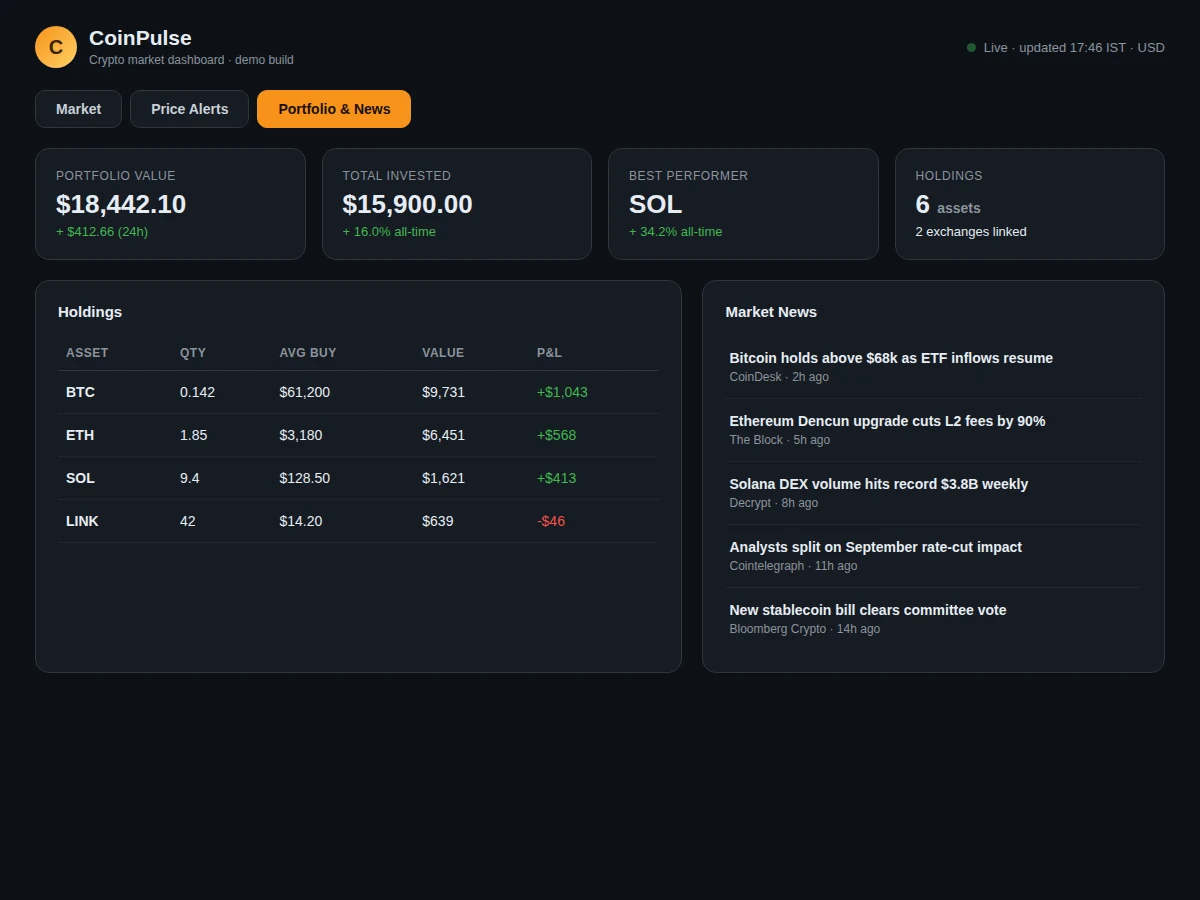
Retail crypto investors juggle half a dozen apps: one for charts, one for news, one for alerts, one for portfolio. This project consolidates the essentials into a single dashboard that follows real trading-desk conventions — dense data tables, red/green change indicators, sparklines, and a live-update feel — implemented in vanilla HTML, CSS and JavaScript. The Market view shows total market cap, 24h volume, BTC dominance and the fear-and-greed index, a canvas-drawn 7-day BTC chart with gradient fill, top movers and an 8-coin table with inline SVG sparklines. The Alerts view lets users create price rules, pause or resume them, and review a trigger history. The Portfolio view tracks holdings with average-buy P&L beside a market news feed. All figures come from a coherent market dataset, so the app is a genuine domain exercise, not a template with random numbers.
How it works
- The app loads a market dataset: coin metadata, 7-day price series, alert rules, portfolio positions and news items.
- The Market view renders overview cards, the BTC canvas chart and the coins table with sparklines drawn from each series.
- Each sparkline is an inline SVG polyline scaled to that coin's own range, colored by its 24h direction.
- The Alerts view lists rules with toggle state; creating a rule appends it to the list and the history logs past triggers.
- The Portfolio view multiplies quantities by current prices and subtracts average-buy cost to show live P&L per holding.
- Tab navigation switches the three views; all rendering is template-string DOM generation from the same dataset.
Tech stack:
- HTML5, CSS3, vanilla JavaScript (ES6)
- Canvas 2D API for the BTC price chart
- Inline SVG sparklines (generated per coin)
- Dark trading-desk theme
- Static deployment (no server or database)
| Parameter | Value |
|---|---|
| Views | 3 (Market, Price Alerts, Portfolio & News) |
| Coins tracked | 8 (demo dataset) |
| Price series | 7-day series per coin for charts and sparklines |
| Alert types | Price above, price below, 24h change above |
| Portfolio | 4 holdings with average-buy P&L |
| Dependencies | None (single HTML file) |
| Data source | Structured demo dataset; API-ready shape |
| Deployment | Any static host |
Project features
- [Top-coins table] Eight coins with prices, 24h/7d changes, market caps and SVG sparklines generated from each coin's price series.
- [Bitcoin 7-day chart] Canvas-drawn price line with gradient fill and labeled price points.
- [Market overview cards] Total cap, 24h volume, BTC dominance and fear-and-greed index in one strip.
- [Price alert system] Create alerts (above/below/change), pause or resume each rule, and review a trigger history log.
- [Portfolio tracker] Holdings table with quantities, average buy prices, current values and computed P&L.
- [Top movers panel] Biggest 24h gainers and losers beside the main chart.
- [Market news feed] Curated-style headlines with sources and timestamps in the portfolio view.
What is included
- Complete source code (single-file dashboard with all three views)
- Realistic crypto market dataset (coins, series, alerts, portfolio, news)
- Canvas chart and SVG sparkline generators
- Setup guide (wiring a live market API such as CoinGecko)
- Project report PDF (domain model, rendering, methodology)
- PPT presentation for final review
- Viva Q&A preparation document (dashboards, canvas/SVG, state)
Limitations & prerequisites
- Ships with a demo dataset, not live prices — live streaming via WebSocket is a documented extension.
- Alerts are evaluated in the demo data model; there is no server-side push delivery in this build.
- Portfolio is a single local snapshot; no multi-exchange sync or transaction import.
- News items are curated demo content, not a live feed.
- No user accounts; all state is client-side.
Frequently Asked Questions
Are the prices live?
The delivered build uses a realistic demo dataset so every screen works offline and deterministically. A guide documents wiring CoinGecko or an exchange WebSocket for live prices.
How do the alerts work?
Each alert is a rule (coin, condition, threshold) with active/paused state. The demo includes a trigger history showing past firings; server-side push delivery is listed as future scope.
How is portfolio P&L computed?
Quantity multiplied by current price, minus quantity multiplied by average buy price — computed live from the holdings data, so you can trace every number.
Can I add more coins?
Yes. Each coin is one object with metadata and a price series; the table, sparklines and movers pick it up automatically.
What will I learn?
Financial-dashboard UI conventions, canvas and SVG charting, DOM templating and domain modelling for market data.
Is this project suitable for a final-year project?
Yes — for Computer Science, IT and Web Development programs. It demonstrates data visualization, state management and product-style UI engineering. Suitable for B.E./B.Tech final-year projects in Computer Science, IT and Web Development.
Components & software requirements
- HTML5, CSS3, vanilla JavaScript (ES6)
- Canvas 2D API for the BTC price chart
- Inline SVG sparklines (generated per coin)
- Dark trading-desk theme
- Static deployment (no server or database)
Delivery information
Built-to-order project. Delivery timeline is shared after order confirmation based on current queue.
Support terms
Complete documentation, setup guide, and viva preparation included. Support for setup and explanation provided.