
More project photos (2)
The problem
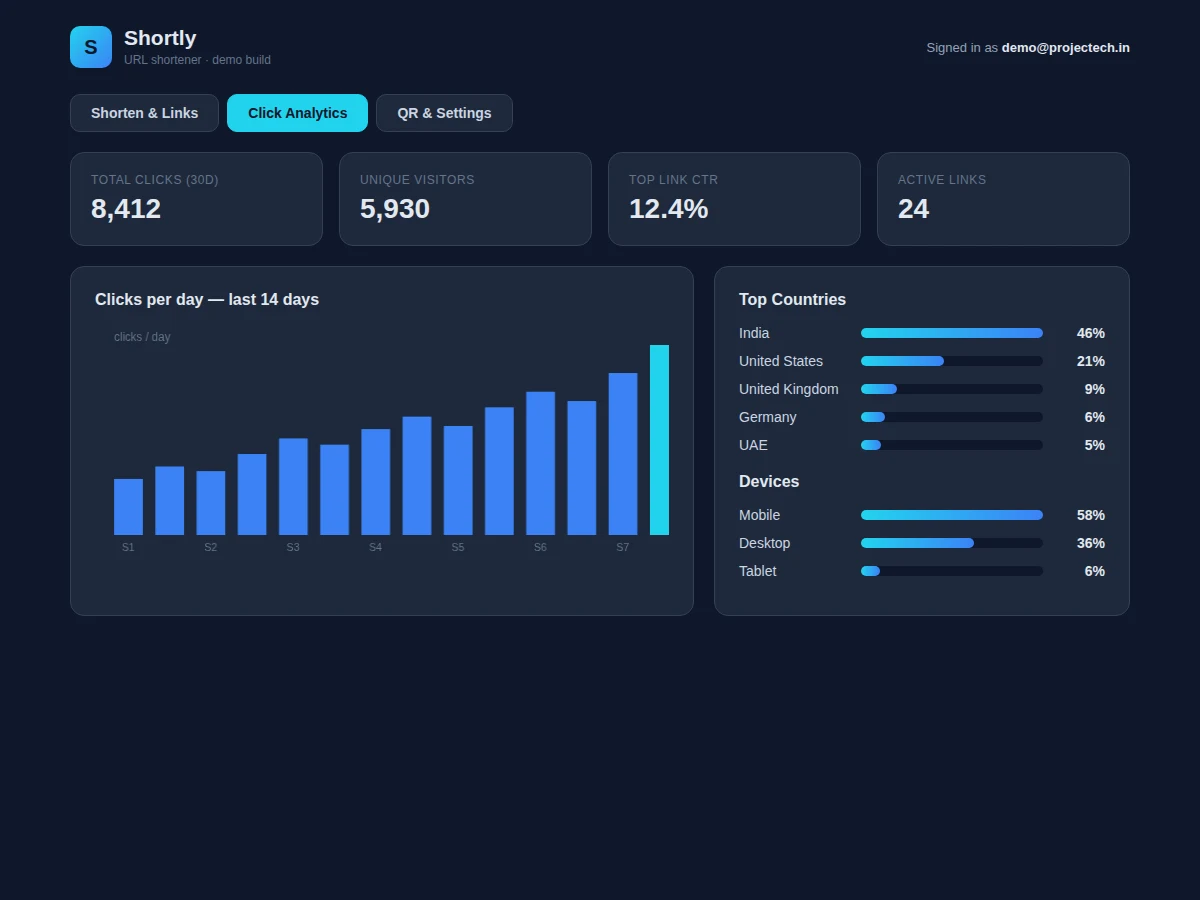
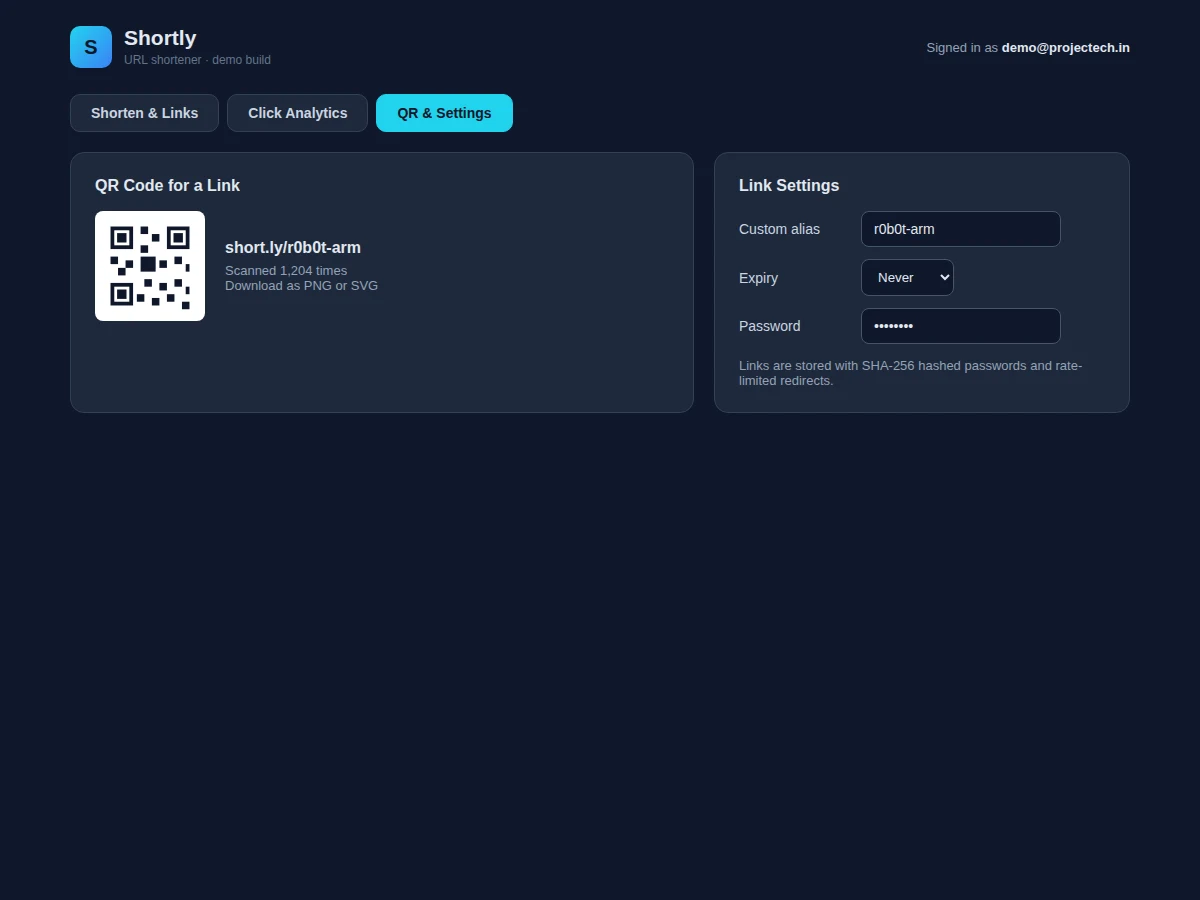
Long URLs break in print, look untrustworthy in messages, and reveal nothing about who clicked them. URL shorteners solve the first two problems; the good ones solve the third with analytics. This project builds Shortly, the full product — not just a shorten box. The hero lets users paste a long URL and get a short link with a copy button. The link manager lists five realistic links with destinations, click counts and creation dates. The analytics dashboard shows total clicks, unique visitors, top-link CTR and active links as stat cards, a 14-day clicks-per-day bar chart on canvas, and top-country and device breakdown bars. The third view generates a scannable QR code per link and exposes link settings: custom alias, expiry and password protection. The whole service domain — links, clicks, aggregates — is modelled in the front end so every screen behaves like the real thing.
How it works
- The user pastes a long URL in the hero; the app generates a short code and shows the result card.
- Links are stored as records with short code, destination, created date, click total and settings.
- The manager table renders every link with its click count and a copy button.
- The analytics view aggregates clicks into a 14-day daily series plus country and device shares, drawn as canvas bars.
- The QR view renders an SVG QR code for the selected link beside its alias, expiry and password settings.
- Tab navigation switches the three views; all figures derive from the same link dataset.
Tech stack:
- HTML5, CSS3, vanilla JavaScript (ES6)
- Canvas 2D API for the clicks-per-day chart
- Inline SVG QR code rendering
- Dark SaaS dashboard theme
- Static deployment for the demo front end
| Parameter | Value |
|---|---|
| Views | 3 (Shorten & Links, Analytics, QR & Settings) |
| Demo links | 5 with destinations, counts and dates |
| Analytics | 14-day series, 5 countries, 3 device classes |
| Alert-style settings | Alias, expiry, password per link |
| QR | SVG-rendered, scannable |
| Dependencies | None (single HTML file) |
| Deployment | Static host for demo; backend needed for production |
Project features
- [Instant shortening] Paste a long URL, get a short link with a result card and copy button.
- [Link manager] Table of short URLs with destinations, click counts, creation dates and copy buttons.
- [Click analytics] Stat cards plus a canvas bar chart of clicks per day over 14 days.
- [Geography and devices] Top-country and device breakdown bars aggregated per link.
- [QR code generation] A scannable QR code rendered per short link with download affordance.
- [Link settings] Custom alias, expiry options and password protection per link.
- [Consistent dataset] Links, clicks and aggregates derive from one model, so all views agree.
What is included
- Complete source code (single-file shortener with all views)
- Realistic link and click dataset
- Canvas chart and QR rendering code
- Setup guide (building the redirect backend with Node.js/Python)
- Project report PDF (service model, analytics, methodology)
- PPT presentation for final review
- Viva Q&A preparation document (shorteners, analytics, hashing)
Limitations & prerequisites
- The demo is front-end only; real redirect resolution needs a backend with a database (documented extension).
- Click counts are demo data; live logging requires the production backend.
- Passwords are described as SHA-256 hashed in the UI copy; the demo does not implement real auth.
- No user accounts, API keys or custom domains in this build.
Frequently Asked Questions
Does shortening really work?
The demo models the full flow — input, code generation, result card, link inventory — in the front end. A setup guide documents the backend (code-to-URL mapping, redirect endpoint, click logging) for a production build.
How are the analytics computed?
Clicks aggregate into a daily series plus country and device shares from the link dataset; the dashboard derives every number from that one model.
Is the QR code real?
Yes — it is drawn as vector shapes encoding the short link and scans with a phone camera in the demo.
How would a production version store links?
A database table mapping short codes to destinations with a unique index, a redirect endpoint that logs each hit, and rate limiting — all outlined in the setup guide.
What will I learn?
Service domain modelling, analytics aggregation, QR encoding concepts and SaaS UI design.
Is this project suitable for a final-year project?
Yes — for Computer Science, IT and Web Development programs. It demonstrates full product thinking from shortening to analytics. Suitable for B.E./B.Tech final-year projects in Computer Science, IT and Web Development.
Components & software requirements
- HTML5, CSS3, vanilla JavaScript (ES6)
- Canvas 2D API for the clicks-per-day chart
- Inline SVG QR code rendering
- Dark SaaS dashboard theme
- Static deployment for the demo front end
Delivery information
Built-to-order project. Delivery timeline is shared after order confirmation based on current queue.
Support terms
Complete documentation, setup guide, and viva preparation included. Support for setup and explanation provided.