
More project photos (2)
The problem
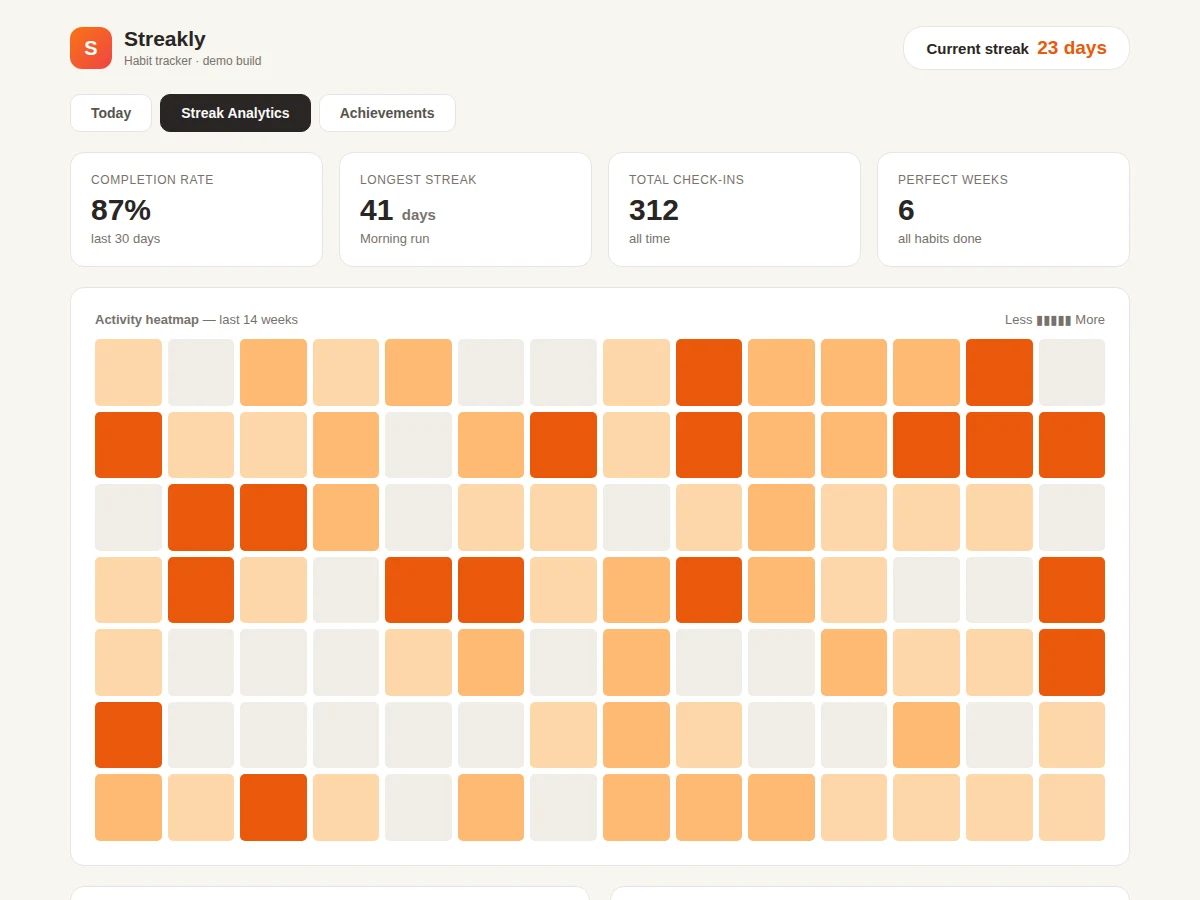
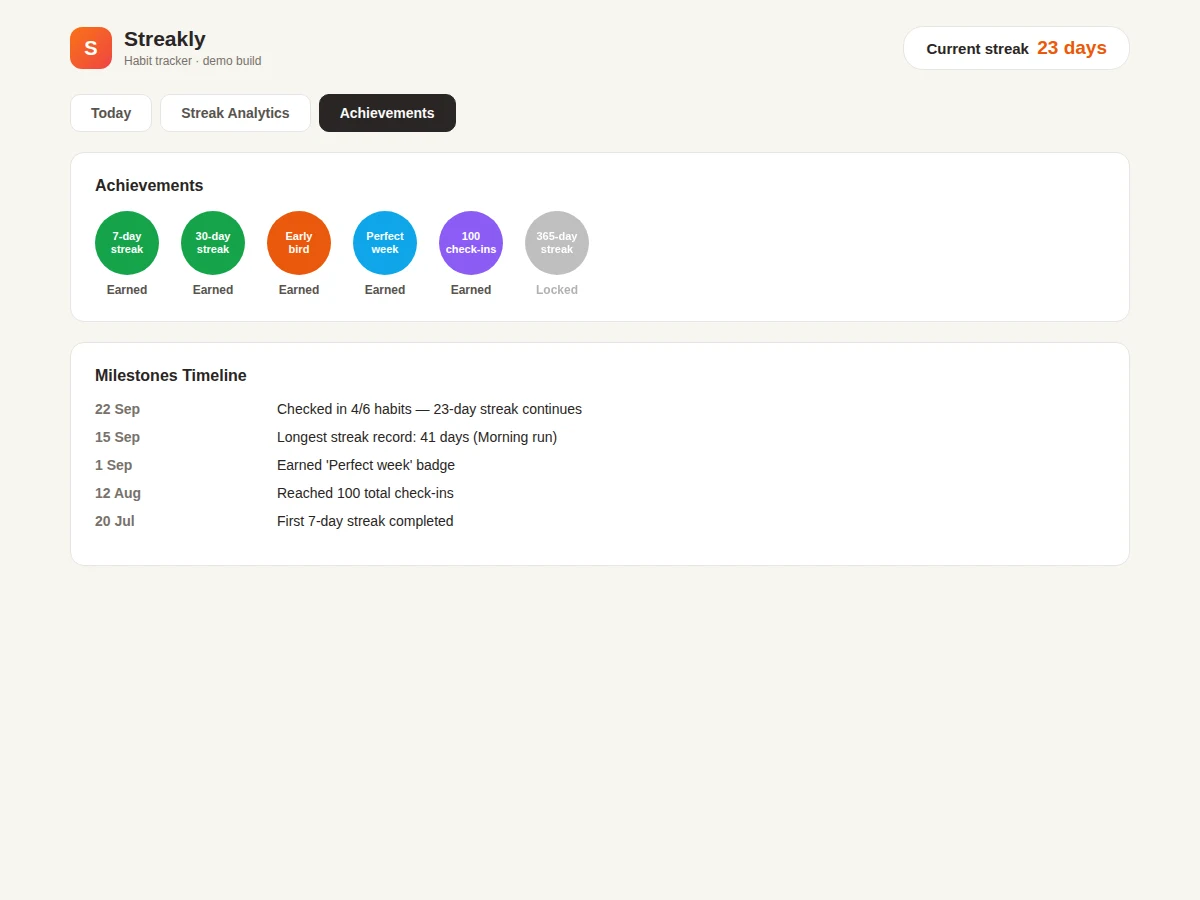
Habit apps live or die on one mechanic: the streak — a visible chain of days the user refuses to break. This project builds Streakly, a complete habit tracker around that psychology. The Today view lists six realistic habits (morning run, reading, meditation, no-sugar, coding, journaling) with schedules, categories and tappable check-in circles that toggle state live, each row showing its current streak and best streak. The Analytics view opens with summary cards (87% completion, 41-day longest streak, 312 check-ins, 6 perfect weeks), then a 14-week activity heatmap, completion-by-habit bars and a best-time-of-day chart on canvas. The Achievements view awards five earned badges plus one locked goal, with a milestones timeline of the user's journey. Every number is computed from the habit dataset, so the student can trace each figure to its source at the viva.
How it works
- The app loads a habit dataset: six habits with schedules, categories, streaks and check-in states.
- The Today view renders check-in rows; tapping a circle toggles that habit's state and re-renders the list.
- Summary cards aggregate the dataset into completion rate, longest streak, total check-ins and perfect weeks.
- Canvas helpers draw the weekly completion bars and the time-of-day chart; the heatmap grid is generated from activity data.
- Per-habit completion bars rank habits by their 30-day rates.
- The Achievements view renders badges with locked/unlocked states and the milestones timeline from event records.
Tech stack:
- HTML5, CSS3, vanilla JavaScript (ES6)
- Canvas 2D API for weekly and time-of-day charts
- Generated heatmap grid (no library)
- Warm editorial theme
- Static deployment (no server or database)
| Parameter | Value |
|---|---|
| Views | 3 (Today, Streak Analytics, Achievements) |
| Demo habits | 6 with schedules, categories, streaks |
| Heatmap | 14 weeks of activity intensity |
| Analytics | Completion, longest streak, per-habit bars, time-of-day |
| Badges | 6 (5 earned, 1 locked) |
| Dependencies | None (single HTML file) |
| Deployment | Any static host |
Project features
- [Daily check-ins] Tappable circles toggle each habit's state with instant visual feedback.
- [Streak tracking] Per-habit current streak and best-streak records, plus a 23-day header pill.
- [Weekly completion chart] Canvas bars showing completion percentage per weekday with the best day highlighted.
- [Activity heatmap] 14-week grid with intensity shading, GitHub-contributions style.
- [Habit analytics] Completion-by-habit bars and best-time-of-day chart from the check-in data.
- [Achievements] Six badges with earned/locked states and a milestones timeline.
- [Warm editorial design] Encouraging cream-and-orange aesthetic instead of clinical fitness-app chrome.
What is included
- Complete source code (single-file tracker with all views)
- Realistic habit dataset with streaks and activity history
- Canvas chart and heatmap generators
- Setup guide (adding habits, localStorage persistence)
- Project report PDF (behavioral design, aggregation, methodology)
- PPT presentation for final review
- Viva Q&A preparation document (gamification, data viz, state)
Limitations & prerequisites
- Check-in state resets on reload in the demo; localStorage persistence is a documented extension.
- Streaks and history are demo data, not the user's real activity.
- No reminders, notifications or social features in this build.
- Single-user only; no accounts or cross-device sync.
Frequently Asked Questions
How are streaks computed?
Each habit carries a current streak and a best streak; the header pill shows the active 23-day chain. The logic counts consecutive check-in days from the activity data.
What does the heatmap show?
Fourteen weeks of daily activity with intensity shading — darker cells mean more habits completed that day, exactly like a contributions graph.
Can I add my own habits?
Yes. A habit is one object with name, schedule, category and streak fields; the Today list, analytics and badges all read from the same array.
How do badges unlock?
Milestone events (7-day streak, 30-day streak, 100 check-ins and so on) flip badges from locked to earned; the timeline narrates each milestone.
What will I learn?
Gamification design, aggregation logic, heatmap visualization and consumer-app UI polish.
Is this project suitable for a final-year project?
Yes — for Computer Science, IT and Web Development programs. It demonstrates data-driven UI and behavioral product design. Suitable for B.E./B.Tech final-year projects in Computer Science, IT and Web Development.
Components & software requirements
- HTML5, CSS3, vanilla JavaScript (ES6)
- Canvas 2D API for weekly and time-of-day charts
- Generated heatmap grid (no library)
- Warm editorial theme
- Static deployment (no server or database)
Delivery information
Built-to-order project. Delivery timeline is shared after order confirmation based on current queue.
Support terms
Complete documentation, setup guide, and viva preparation included. Support for setup and explanation provided.