
More project photos (2)
The problem
Every sowing season, farmers and agri-traders make expensive decisions — what to plant, how much fertilizer to buy, what volumes to contract — without knowing what the harvest will actually deliver. Traditional yield estimation leans on experience, thumb rules, or coarse district averages that ignore how rainfall, temperature and soil nutrients interact on a specific field. Machine learning fills this gap honestly: historical records of weather, soil NPK and yields contain learnable non-linear relationships, and Random Forest is a natural fit for such tabular farm data because it models interactions (rainfall matters differently at different temperatures) without hand-built formulas. This project builds that system as a complete regression pipeline: public crop-yield records in, expected yield in tonnes per hectare out, with feature importances that show exactly which inputs drive each prediction.
How it works
- The public Kaggle crop-yield dataset (country × year × crop records with rainfall, temperature, NPK, pesticide/fertilizer inputs and yield target) is loaded and cleaned; impossible nutrient values and outlier yields are removed.
- The crop label is one-hot encoded and numeric features are standardized with a scaler fitted only on the training split, then the data is split 80/20 into train and holdout sets.
- A RandomForestRegressor with 300 trees trains on bootstrap samples; each tree sees a random feature subset at every split, which decorrelates the trees.
- Hyperparameters (max depth, minimum samples per leaf) are tuned with 5-fold cross-validation on the training data; the best configuration is refit on the full training set.
- R², RMSE and MAE are computed on the untouched 20% holdout, with actual-vs-predicted scatter and residual plots for the error-analysis section of the report.
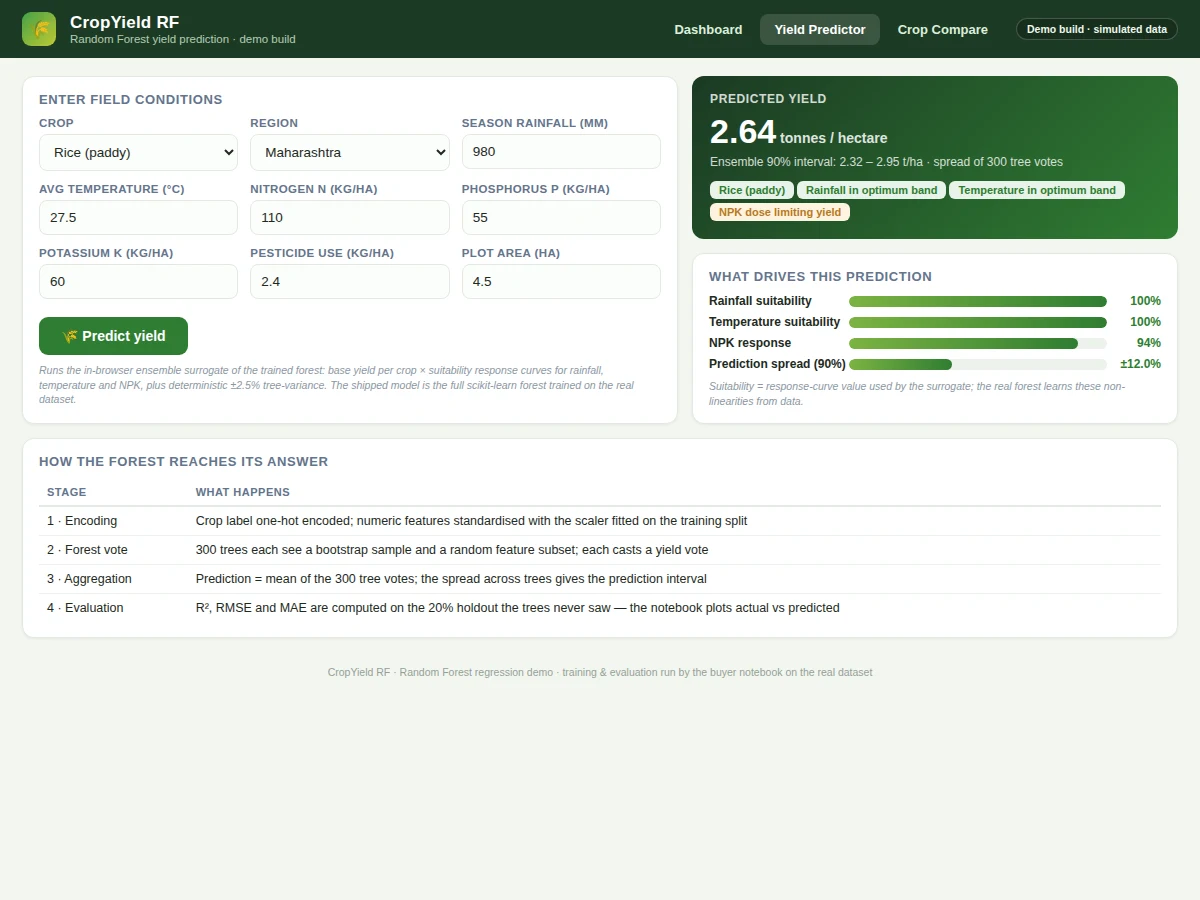
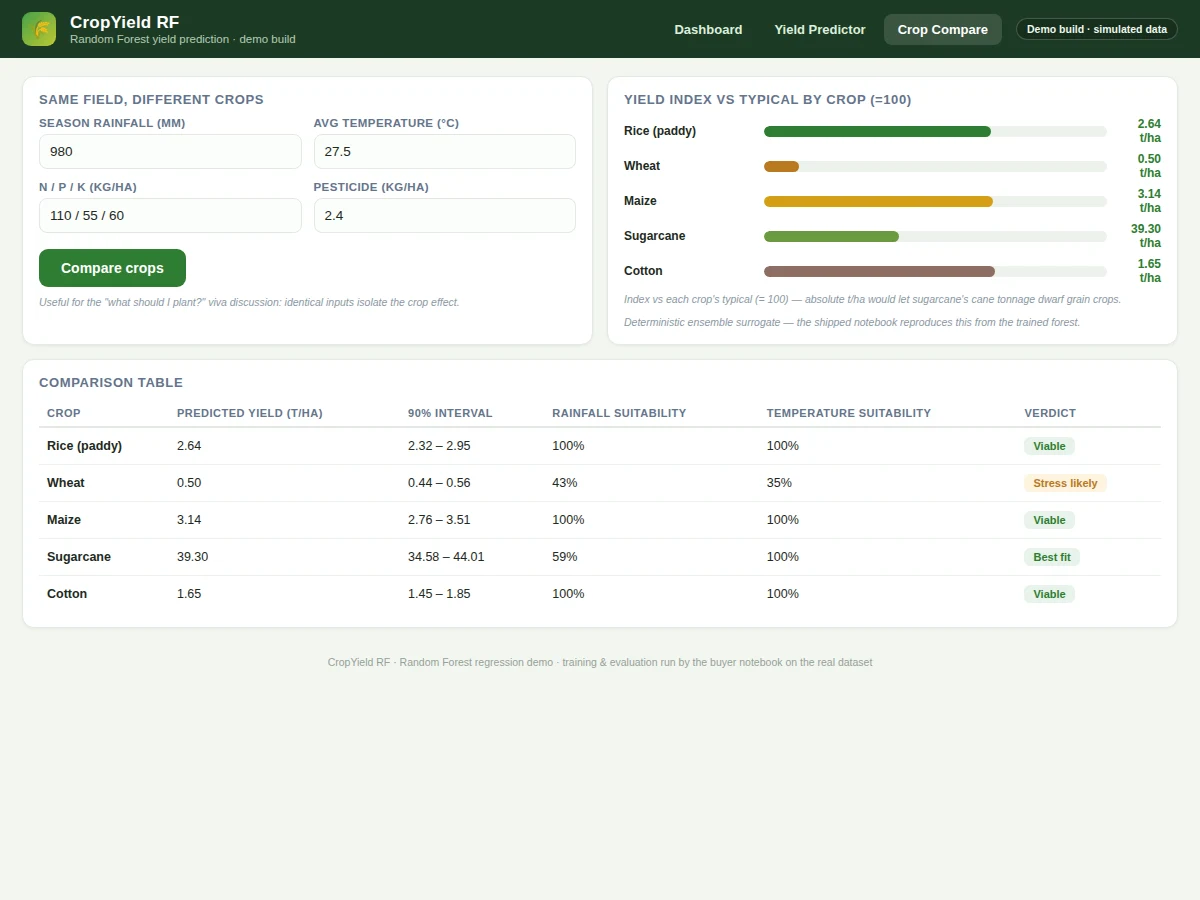
- At inference time the demo app applies the saved scaler, queries the forest, and renders the mean prediction, the tree-vote interval, per-factor suitability scores and the cross-crop comparison.
Tech stack:
- Python 3.10, scikit-learn (RandomForestRegressor, GridSearchCV, metrics)
- pandas, NumPy (data wrangling, feature tables)
- Matplotlib, Seaborn (actual-vs-predicted, residuals, importance plots)
- Jupyter notebook (buyer-run training and evaluation)
- Flask demo app (prediction form, comparison view)
- joblib (serialized model + scaler artifacts)
| Parameter | Value |
|---|---|
| Model | RandomForestRegressor, 300 trees, tuned max depth (scikit-learn) |
| Task | Regression — yield in tonnes per hectare |
| Features | Season rainfall, avg temperature, N, P, K, pesticide use, plot area, crop (one-hot) |
| Dataset | Kaggle Crop Yield Prediction dataset (public; country × year × crop records) |
| Split | 80/20 train-holdout; 5-fold cross-validation on the training set |
| Metrics | R², RMSE, MAE — computed by the buyer-run notebook on the holdout |
| Design target | R² ~0.80–0.85 on the holdout (target, not a pre-claimed result) |
| Input | Field conditions via the demo form or CSV rows |
| Output | Predicted yield (t/ha), 90% prediction interval, suitability flags |
| Training hardware | Any modern CPU; no GPU needed; training completes in minutes |
Project features
- [Yield prediction from field inputs] Enter crop, region, season rainfall, temperature, soil N/P/K and pesticide use; the trained forest returns expected yield in tonnes per hectare with a prediction interval derived from the spread of tree votes.
- [Random Forest regressor, 300 trees] Scikit-learn RandomForestRegressor with tuned depth and leaf settings; hyperparameters chosen by 5-fold cross-validation and a small grid search, all logged in the notebook.
- [Feature importance analysis] Mean-decrease-in-impurity importances rank every input — typically rainfall and temperature on top — giving the report a ready-made explainability section.
- [What-if crop comparison] Replay identical field conditions across rice, wheat, maize, sugarcane and cotton to see which crop the model favours, with suitability flags when inputs leave a crop's optimum band.
- [Buyer-run training and evaluation notebook] One notebook cleans the data, trains, tunes, and computes R², RMSE and MAE on the 20% holdout the trees never saw, with actual-vs-predicted and residual plots.
- [Prediction intervals, not just point estimates] The demo shows the ensemble's 90% interval so the report can discuss uncertainty honestly instead of pretending a single number is certain.
- [Serialized model + scaler] The fitted forest and the preprocessing scaler ship as versioned artifacts, so inference applies exactly the transformation training used.
What is included
- Complete source code (data prep, training, tuning, evaluation, inference, demo app)
- Jupyter training and evaluation notebook (buyer-run: clean, train, tune, evaluate, plot)
- Serialized model and scaler artifacts from the reference training run
- Project report PDF (background, methodology, evaluation, error analysis, limitations)
- PPT presentation for final review
- Viva Q&A preparation document (ensembles, bias-variance, impurity importance, CV)
- Setup guide (environment, dataset download, running the notebook, using the demo)
Limitations & prerequisites
- Predictions are reliable only near the training distribution; for input combinations far outside it (e.g. extreme drought years) the model extrapolates and the interval widens — the report documents this openly.
- The public dataset aggregates at country × year × crop grain, so field-level micro-variation (soil patches, local pests) is invisible to the model; district-level IMD data is listed as future scope, not current capability.
- Weather inputs are season aggregates, not forecasts — the system answers "given this season's conditions, what yield?" not "what will the weather be?".
- The model captures correlation, not agronomic causation; it is a planning aid prototype, not a substitute for agronomist advice.
- Yield is reported in tonnes per hectare; converting to revenue needs prices, which the base project does not model.
Frequently Asked Questions
Which dataset is used?
The public Kaggle Crop Yield Prediction dataset: country × year × crop records with rainfall, temperature, soil NPK, pesticide/fertilizer use as inputs and yield as the regression target. The notebook downloads and documents it; you can extend it with your own regional rows.
Is the accuracy guaranteed?
No — and any listing that guarantees it is lying. The design target is R² ~0.80–0.85 on the holdout, but the actual figure comes from your own training run in the included notebook, and the report presents your measured numbers with error analysis.
Why Random Forest instead of a neural network?
Tabular farm data with a few thousand rows and mixed features is exactly where tree ensembles beat deep learning: they train in minutes on CPU, resist overfitting through bagging, and give feature importances a viva examiner can interrogate.
Can I add my own region's data?
Yes. The preprocessing pipeline accepts additional CSV rows with the same columns; the notebook re-runs cleaning, training and evaluation end to end, so your regional data becomes part of the measured results.
Can new crops be added?
Yes — any crop with sufficient historical rows can be added to the training data; the one-hot encoding and the comparison view pick it up automatically after retraining.
Does it need internet?
Only to download the public dataset once. Training, evaluation and the demo all run fully offline. Suitable for B.E./B.Tech final-year projects in Computer Science, AI/ML and Data Science.
Components & software requirements
- Python 3.10, scikit-learn (RandomForestRegressor, GridSearchCV, metrics)
- pandas, NumPy (data wrangling, feature tables)
- Matplotlib, Seaborn (actual-vs-predicted, residuals, importance plots)
- Jupyter notebook (buyer-run training and evaluation)
- Flask demo app (prediction form, comparison view)
- joblib (serialized model + scaler artifacts)
Delivery information
Built-to-order project. Delivery timeline is shared after order confirmation based on current queue.
Support terms
Complete documentation, setup guide, and viva preparation included. Support for setup and explanation provided.