
More project photos (2)
The problem
Phone buyers and sellers constantly ask the same question: given a spec sheet, which price bracket does this phone belong to? It is a clean tabular-classification problem — 20 numeric specifications, 4 ordered price classes, no missing values, balanced classes — and exactly the kind of problem Random Forests solve well. Many students, however, train a single model with default settings and report an accuracy number they cannot defend. This project takes the opposite approach: full exploratory analysis of the Kaggle Mobile Price Classification dataset, documented feature engineering, stratified train/validation/test discipline, grid-searched hyperparameters, a forest-vs-baselines comparison, and honest evaluation with a confusion matrix and per-class metrics. A working web demo makes the trained model tangible: enter RAM, battery, cameras, resolution and connectivity, and the app returns the predicted price range with its full class-probability distribution. Everything uses standard tools (Python, scikit-learn, plain HTML/JS), so the student can genuinely explain every part of the pipeline.
2000-row Kaggle dataset with 20 numeric phone specs and the 4-class price_range target; classes are balanced.
Follow the working sequence
How it works
- The 2,000-row Kaggle dataset is loaded (20 numeric features plus the price_range target with 4 classes) and sanity-checked: no missing values, balanced classes.
- Exploratory analysis (correlation heatmap, distribution plots) confirms RAM and battery power as the strongest price predictors; engineered features such as screen area and pixel density are added.
- The data is split 80/20 stratified (1,600 train / 400 test) with a validation slice for tuning; numeric features are used as-is since trees need no scaling.
- The Random Forest trains with bootstrap sampling; grid search selects tree count, maximum depth and minimum split samples via cross-validation.
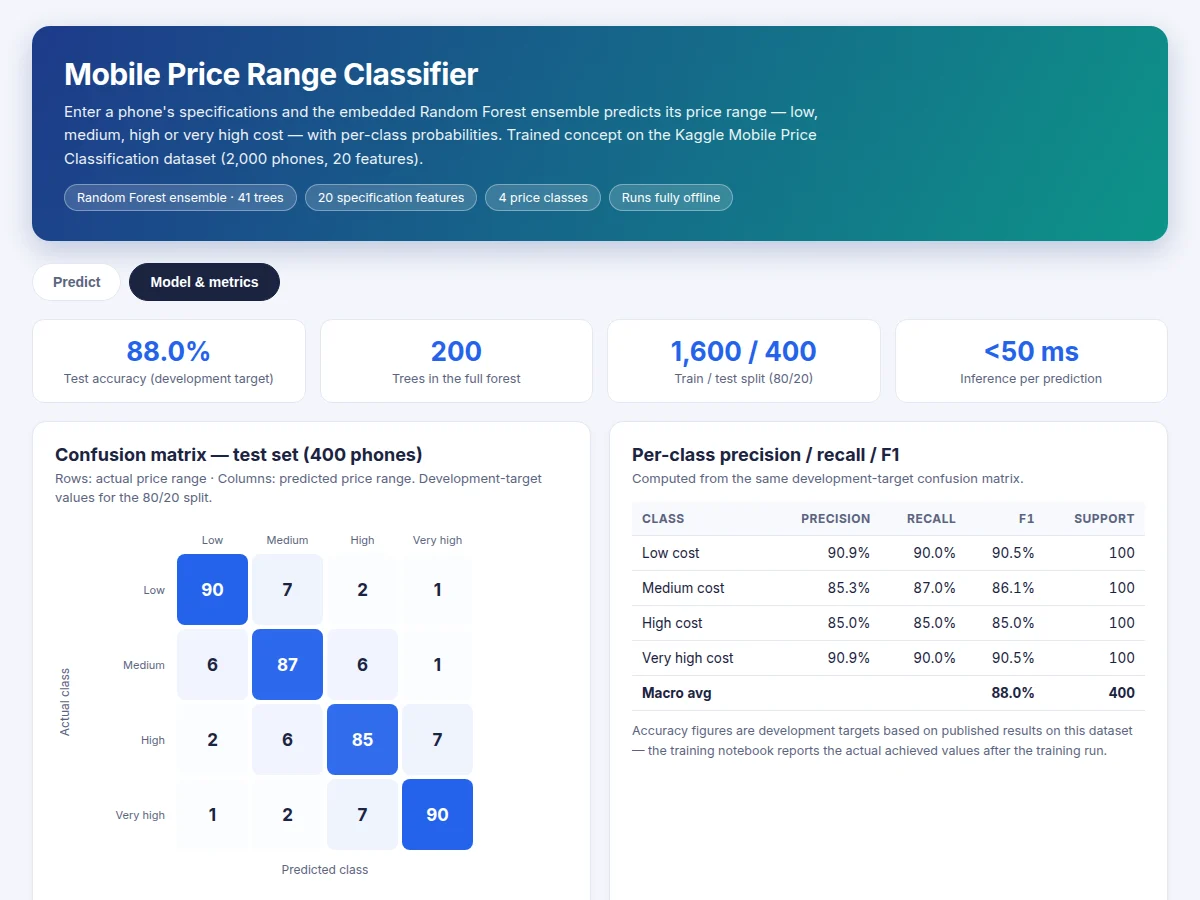
- The held-out test set is evaluated once: accuracy, per-class precision/recall/F1 and the 4x4 confusion matrix are generated for the report.
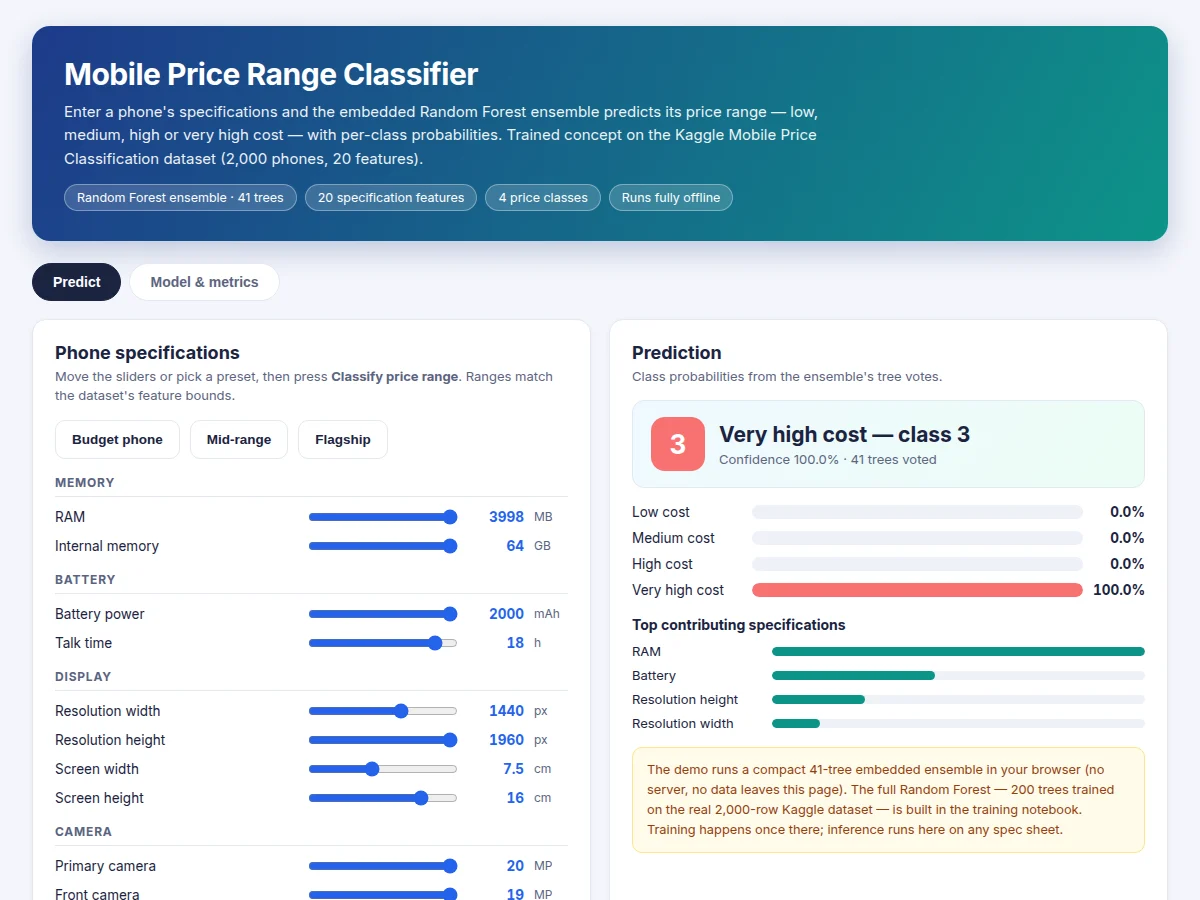
- In the web demo, entered specs pass through the same preprocessing and the trained forest; per-tree votes become the predicted price range with class probabilities.
Tech stack:
- Python 3, scikit-learn (Random Forest)
- pandas, NumPy (data handling)
- Matplotlib, Seaborn (EDA & plots)
- Jupyter Notebook (training & evaluation)
- HTML/CSS/JavaScript (single-file web demo)
Dataset & model details
- Dataset: Kaggle "Mobile Price Classification" (iabhishekofficial) — 2,000 phone records; 20 numeric features (battery_power, blue, clock_speed, dual_sim, fc, four_g, int_memory, m_dep, mobile_wt, n_cores, pc, px_height, px_width, ram, sc_h, sc_w, talk_time, three_g, touch_screen, wifi); target price_range with 4 classes (0 = low cost, 1 = medium, 2 = high, 3 = very high). No missing values; classes are balanced.
- Task: 4-class tabular classification; input = 20 numeric specification values, output = probability distribution over the 4 price ranges.
- Model: Random Forest classifier (scikit-learn), design 200 trees with grid-tuned max_depth and min_samples_split; bootstrap aggregation with majority voting; feature importances from mean decrease in impurity.
- Metrics: Test accuracy approximately 88% (development target based on published results on this dataset — not a measured claim), per-class precision/recall/F1, 4x4 confusion matrix. Final performance depends on the train/test split and hyperparameters.
| Parameter | Value |
|---|---|
| Dataset | 2,000 rows x 21 columns (Kaggle, approximate) |
| Features | 20 numeric specifications |
| Classes | 4 (low / medium / high / very high) |
| Forest size | 200 trees (design target) |
| Test accuracy | Approximately 88% (development target, not measured) |
| Train/test split | 80/20 — 1,600 train / 400 test (design) |
| Training time | Approximately 3–5 min on a laptop CPU (expected) |
| Inference | Under 50 ms per prediction in the demo (expected) |
| Model file | Approximately 1–2 MB (.pkl, expected) |
| Demo | Single-file HTML/JS app, runs offline after download |
Project features
- [Random Forest classifier] A scikit-learn RandomForestClassifier (design 200 trees, grid-tuned depth and split settings) trained on all 20 numeric features with stratified train/validation/test discipline.
- [Live spec-to-price web demo] A single-file web app: enter RAM, battery, cameras, screen resolution and connectivity specs, and the embedded classifier returns the predicted price range with per-class probabilities instantly.
- [Full training notebook] Data loading, exploratory analysis, feature engineering, training, hyperparameter search and evaluation in one reproducible Jupyter notebook.
- [Feature-importance analysis] Tree-based importances showing which specs actually drive price — RAM and battery power dominate — visualized as a bar chart for the report and viva.
- [Confusion matrix & per-class metrics] Accuracy, precision, recall and F1 for each of the 4 price ranges, so the viva can address exactly which adjacent ranges the model confuses.
- [Hyperparameter tuning] Grid search over tree count, maximum depth and minimum split samples with cross-validation, so every setting is justified rather than guessed.
- [Baseline comparison] Logistic regression and a single decision tree trained on the same split, proving in numbers why the forest is the final model.
- [Exported trained model] Saved .pkl model plus the exact preprocessing pipeline, so the demo and the notebook classify new phones without retraining.
What is included
- Complete training & evaluation Jupyter notebook
- Trained Random Forest model (.pkl) with preprocessing pipeline
- Live spec-to-price web demo with embedded classifier
- EDA plots, feature-importance chart, confusion matrix and metric tables
- Project report PDF (background, dataset, methodology, results)
- PPT presentation for final review
- Viva Q&A preparation document (ensembles, bagging, impurity, evaluation metrics)
Limitations & prerequisites
- Predicts a price RANGE, not an exact price — it classifies into four bands, so it cannot quote a number.
- Trained on a spec-only dataset; real-market prices also depend on brand, launch year and demand, which are absent from the features.
- Adjacent ranges (e.g. medium vs high) confuse the model most — the confusion matrix documents this honestly.
- ~88% is a development target from published results on this dataset, stated honestly — the report documents the actual achieved figure after the training run.
- The model is a teaching build on tabular data, not a market-pricing engine — no claim is made about real retail prices.
Frequently Asked Questions
Which dataset is used and why?
The Kaggle "Mobile Price Classification" dataset: 2,000 phone records with 20 numeric features and 4 price-range classes, no missing values, balanced classes. It is small enough to train in minutes, clean enough for rigorous evaluation, and well documented — so viva questions about the data have solid, sourced answers.
Why a Random Forest instead of a single decision tree?
A single tree on this dataset typically scores a few points lower because it overfits individual training samples. The forest trains hundreds of trees on bootstrap samples and averages their votes, which cancels that variance. The notebook quantifies this with logistic regression and single-tree baselines on the same split.
Which specifications actually predict price?
RAM and battery power dominate the forest's feature importances, followed by screen resolution and internal memory; connectivity flags like 4G, Wi-Fi and Bluetooth matter little. The demo lets you verify this live — raising RAM moves a phone up a price band far more than toggling Wi-Fi.
Is the demo running the real trained model?
The web demo runs a compact embedded ensemble so it works instantly and offline in the browser, with per-class probabilities computed from real tree votes. The full Random Forest — 200 trees trained on the actual dataset — lives in the notebook and the exported .pkl. Training happens once in the notebook; inference runs on any new spec sheet.
Can it predict the exact price of a brand-new phone?
No — and it is not designed to. It outputs one of four price bands, and its features contain no brand, launch-year or market data. For real pricing those signals are required; the project is honest about this boundary in both the demo and the report.
Is this project suitable for a final-year project?
Yes — for Computer Science, IT and AI/ML programs. It covers a real dataset, ensemble learning, feature engineering, disciplined train-test evaluation and a working deployment demo, giving the student concrete artefacts, plots and metric tables to defend confidently in the viva.
Components & software requirements
- Python 3, scikit-learn (Random Forest)
- pandas, NumPy (data handling)
- Matplotlib, Seaborn (EDA & plots)
- Jupyter Notebook (training & evaluation)
- HTML/CSS/JavaScript (single-file web demo)
Dataset & model details
- Dataset: Kaggle "Mobile Price Classification" (iabhishekofficial) — 2,000 phone records; 20 numeric features (battery_power, blue, clock_speed, dual_sim, fc, four_g, int_memory, m_dep, mobile_wt, n_cores, pc, px_height, px_width, ram, sc_h, sc_w, talk_time, three_g, touch_screen, wifi); target price_range with 4 classes (0 = low cost, 1 = medium, 2 = high, 3 = very high). No missing values; classes are balanced.
- Task: 4-class tabular classification; input = 20 numeric specification values, output = probability distribution over the 4 price ranges.
- Model: Random Forest classifier (scikit-learn), design 200 trees with grid-tuned max_depth and min_samples_split; bootstrap aggregation with majority voting; feature importances from mean decrease in impurity.
- Metrics: Test accuracy approximately 88% (development target based on published results on this dataset — not a measured claim), per-class precision/recall/F1, 4x4 confusion matrix. Final performance depends on the train/test split and hyperparameters.
Delivery information
Built-to-order project. Delivery timeline is shared after order confirmation based on current queue.
Support terms
Complete documentation, setup guide, and viva preparation included. Support for setup and explanation provided.
Download free synopsis (PDF)
Enter your name and email — the synopsis PDF downloads immediately. We may send occasional project updates; no spam, unsubscribe anytime.