
More project photos (2)
The problem
Hard drives rarely fail without leaving traces — SMART telemetry records reallocated sectors, uncorrectable errors and pending sectors long before a drive dies. Yet most users and small teams only look at this data after a failure, because reading dozens of raw attributes per drive every day is tedious and the relationship between any single counter and failure is noisy. Backblaze has published quarterly drive-stats snapshots from its datacenter fleet since 2013, including daily SMART readings and failure labels — the industry's largest public reliability dataset — and it is exactly the kind of real, imbalanced, messy data that separates textbook ML from applied ML. This project turns that data into a working failure-prediction pipeline: SMART CSVs are cleaned and featurized, a Random Forest binary classifier learns the failure signatures, and a dashboard ranks drives by predicted failure probability with configurable alert thresholds. There is no invented accuracy here — the model is evaluated with precision, recall, F1 and ROC-AUC, the metrics that actually matter when only ~1.5% of drives fail.
Daily SMART snapshots and failure labels from the public Backblaze dataset, published quarterly since 2013.
Follow the working sequence
How it works
- Backblaze-format CSV snapshots (daily SMART readings + a failure label column) are loaded and aligned; failure labels are propagated so each drive-day is a labeled training example.
- Rows are cleaned: drives with insufficient history are dropped, zero-filled attributes from manufacturers that do not report them are handled, and SMART 5/187/188/197/198, power-on hours and temperature are selected as features.
- The data is split by drive (not by row) into train and hold-out test sets, so the model is evaluated on drives it has never seen — an 80/20 split by drive identity.
- Class imbalance (~1.5% failures) is addressed with class-weighted Random Forest training and an appropriate decision threshold, documented in the report.
- A Random Forest classifier (configurable tree count and depth, documented defaults) is trained on the training set; feature importances are recorded.
- The hold-out set is scored once: precision, recall, F1 and ROC-AUC are computed, with a confusion matrix showing exactly how many failures were caught vs missed.
- For inference, the same pipeline reads a fresh SMART snapshot CSV and emits per-drive failure probabilities into the risk dashboard with threshold alerts.
Tech stack:
- Python 3, pandas, NumPy
- scikit-learn (Random Forest, train/test split, metrics)
- Jupyter Notebook (training & evaluation)
- Matplotlib, seaborn (evaluation plots)
- HTML/CSS/JavaScript dashboard (risk scoring UI)
- Backblaze Drive Stats dataset (public quarterly release)
Dataset & model details
- Dataset: Backblaze Drive Stats — daily hard-drive health snapshots from Backblaze's datacenter fleet, published quarterly since 2013, hundreds of thousands of drives (reported at 350,000+ in 2026). Free to download from Backblaze's Drive Stats page. Columns: date, serial number, drive model, failure flag, and raw/normalized SMART attribute readings per drive-day. Failures are rare (~1.5% annualized failure rate), making this an imbalanced binary classification problem.
- Task: Binary classification (failed vs healthy); input = one drive-day feature vector (SMART 5 Reallocated Sectors Count, 187 Reported Uncorrectable Errors, 188 Command Timeout, 197 Current Pending Sector Count, 198 Uncorrectable Sector Count, power-on hours, temperature); output = failure probability.
- Model: Random Forest classifier with class weights to handle imbalance; inputs are per-drive feature vectors, predictions are failure probabilities; decision threshold is configurable and its precision–recall trade-off is analyzed in the report.
- Metrics: ROC-AUC (design target ~0.88), F1-score, precision and recall at the chosen threshold, confusion matrix on the hold-out set. Design targets only — the report documents the actual achieved figures after the training run for the order. No accuracy is claimed as measured until the model is trained.
| Parameter | Value |
|---|---|
| Dataset | Backblaze Drive Stats (public quarterly release) |
| Fleet scale in source data | Approximately 350,000+ datacenter drives (2026) |
| Failure rate in data | Approximately 1–2% annualized (highly imbalanced) |
| SMART features used | 5 attributes + power-on hours + temperature |
| Model | Random Forest classifier (class-weighted) |
| Train/test split | 80/20 split by drive identity (no drive leakage) |
| ROC-AUC | 0.88 (design target, not a measured claim) |
| Inference | Batch scoring of a snapshot CSV (expected under 1 minute for 10,000 drive-days on a laptop) |
| Dashboard | Single-file web app, runs offline after download |
Project features
- [SMART CSV ingestion] Parses Backblaze-format daily drive-stat CSVs, handling the published schema (date, serial, model, failure flag, raw SMART attribute columns) including missing or zero-filled attributes from different manufacturers.
- [Failure-probability classifier] A trained Random Forest binary classifier (failed vs healthy) using SMART 5, 187, 188, 197, 198 plus power-on hours and drive temperature as features.
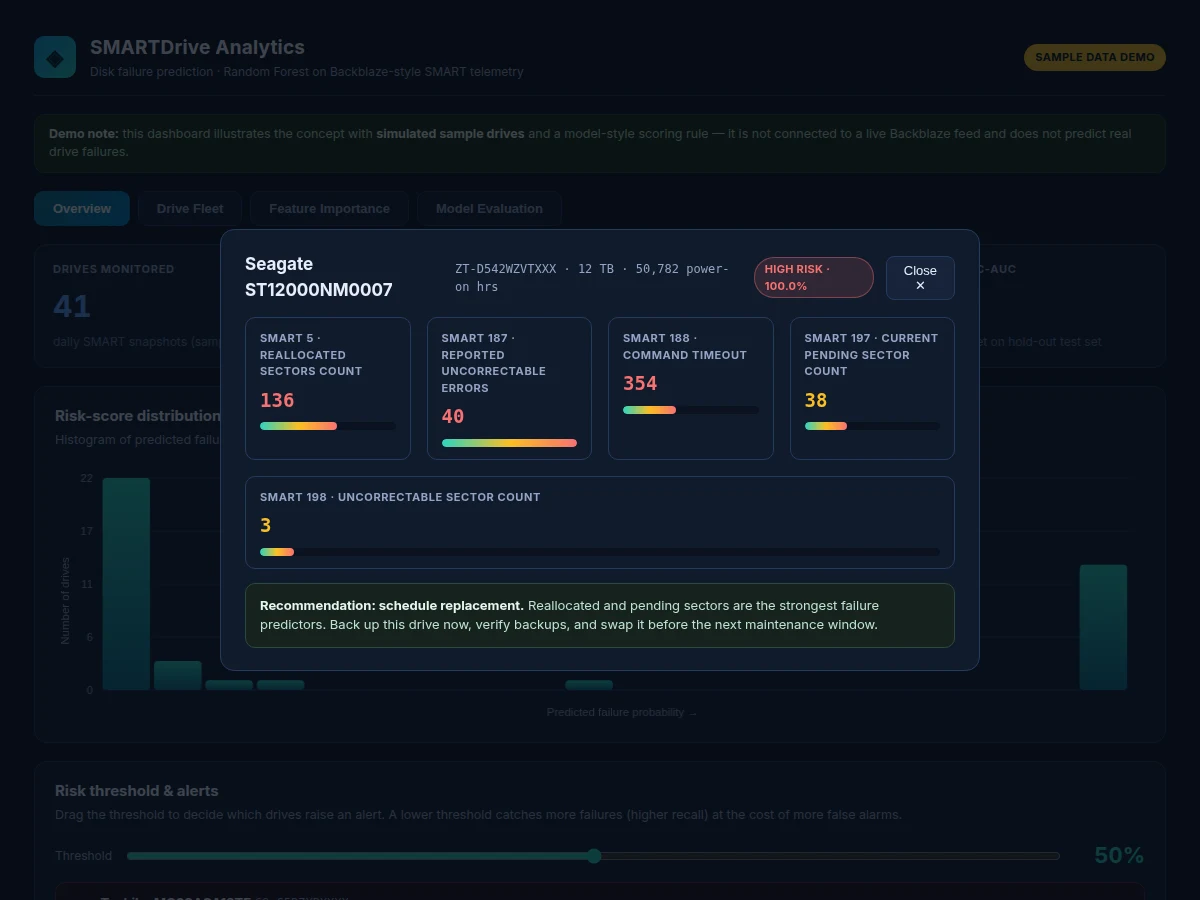
- [Per-drive risk scoring] Every drive gets a failure probability between 0 and 1 from the trained model, with the risk band (low / medium / high) shown alongside the score.
- [At-risk drive ranking] The fleet dashboard sorts and filters drives by predicted failure probability, SMART counters and drive model, with click-through per-drive detail.
- [Configurable threshold alerts] The alert threshold is adjustable; every drive above it is listed with its SMART counters and probability, illustrating the precision–recall trade-off of threshold choice.
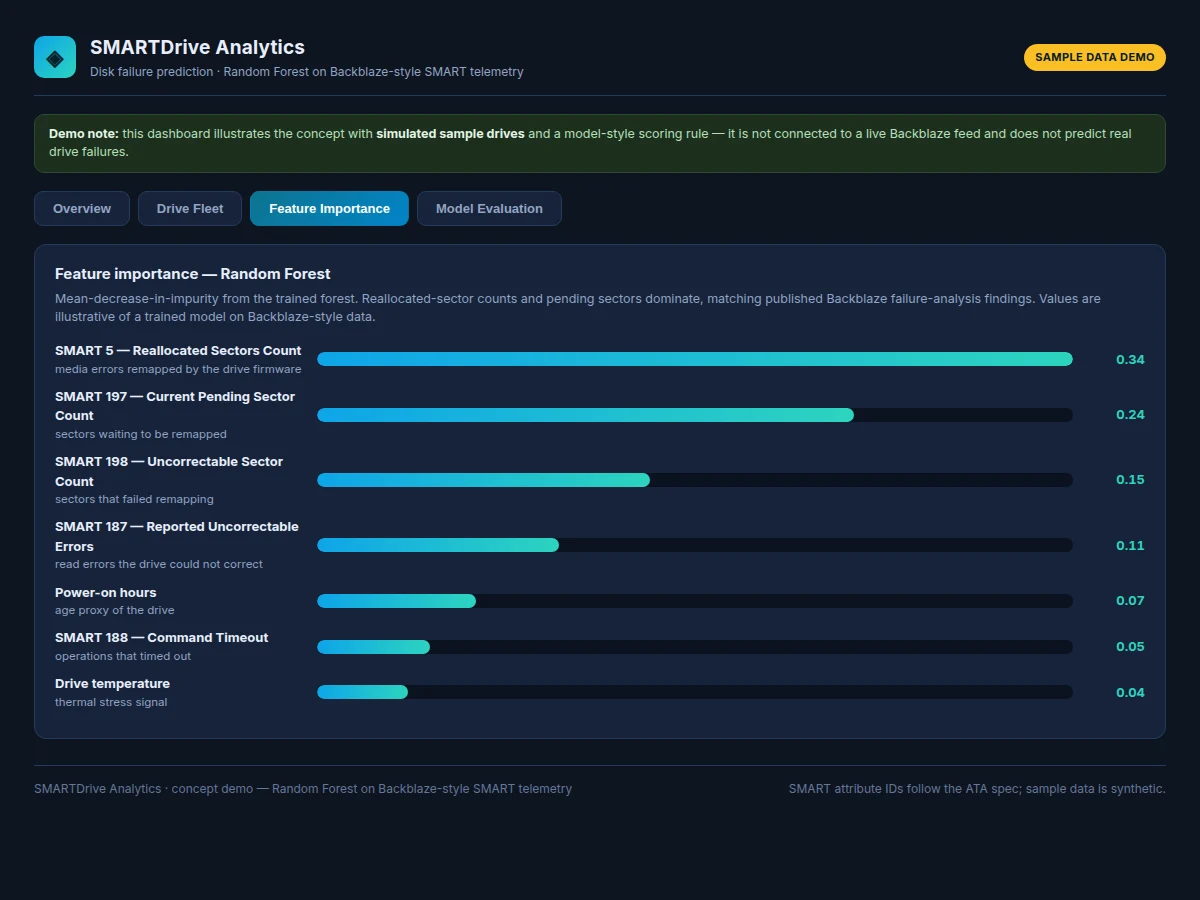
- [Feature-importance view] Mean-decrease-in-impurity importances from the trained forest, showing which SMART attributes drive the predictions.
- [Evaluation report] Precision, recall, F1-score and ROC-AUC on a hold-out test set with a confusion matrix, written up with the class-imbalance analysis a viva expects.
What is included
- Complete data-cleaning and training Jupyter notebook
- Trained Random Forest model file with the preprocessing pipeline
- Risk-scoring dashboard web app wired to the trained model
- Evaluation report with precision, recall, F1, ROC-AUC and confusion matrix
- Project report PDF (background, dataset analysis, methodology, results)
- PPT presentation for final review
- Viva Q&A preparation document (class imbalance, SMART attributes, Random Forest internals, threshold trade-offs)
Limitations & prerequisites
- The model predicts statistical risk, not exact failure dates — it ranks drives by likelihood of failing, it cannot say a drive will fail next Tuesday.
- Class imbalance makes false alarms unavoidable; catching most failures means tolerating some healthy drives flagged, and the report shows this trade-off honestly.
- SMART attribute reporting varies by manufacturer — some drives report zero or missing values for attributes they do not track, which limits cross-brand comparability.
- Backblaze data comes from datacenter drives in controlled environments; failure patterns may not transfer to laptop or external consumer drives.
- The 0.88 ROC-AUC is a design target for the training run, stated honestly — the report documents the actual achieved figure after training.
- The demo dashboard ships with sample data; wiring it to a real daily Backblaze download is documented as an extension, not included by default.
Frequently Asked Questions
Which dataset is used and is it real?
Yes — Backblaze Drive Stats, a public dataset published quarterly since 2013 with daily SMART snapshots and failure labels from Backblaze's datacenter fleet (350,000+ drives reported in 2026). It is the standard real-world dataset for drive-reliability research and is free to download.
Which SMART attributes matter most?
Typically SMART 5 (Reallocated Sectors Count), 197 (Current Pending Sector Count) and 198 (Uncorrectable Sector Count) — drives showing rising values in these attributes fail far more often. The trained model's feature-importance view in the dashboard shows exactly this ranking.
Why a Random Forest and not deep learning?
SMART data is tabular with only a few dozen features, where tree ensembles routinely match or beat neural networks. Random Forests also handle the extreme class imbalance well, train in minutes on a laptop, and produce interpretable feature importances — all stronger viva arguments than a black-box network for this data shape.
Is the accuracy guaranteed?
No — and any seller who guarantees one is not being honest. With ~1.5% failures, plain accuracy is meaningless (predicting "healthy" always scores 98%). The project is evaluated on ROC-AUC, precision and recall, and the report documents the actually achieved figures from the training run.
Can this predict when my own drive will fail?
Not as shipped — it is trained on datacenter drive patterns and predicts statistical risk, not dates. Running the pipeline on your own SMART exports (e.g. via smartmontools) is a documented extension, and the report covers why consumer-drive transfer is limited.
Is this project suitable for a final-year project?
Yes — for Computer Engineering, IT and AI/Data Science programs. It demonstrates end-to-end dataset handling, a class-imbalance strategy, model training with honest evaluation on real industry data, plus a working risk dashboard that makes the predictions tangible for reviewers and examiners.
Components & software requirements
- Python 3, pandas, NumPy
- scikit-learn (Random Forest, train/test split, metrics)
- Jupyter Notebook (training & evaluation)
- Matplotlib, seaborn (evaluation plots)
- HTML/CSS/JavaScript dashboard (risk scoring UI)
- Backblaze Drive Stats dataset (public quarterly release)
Dataset & model details
- Dataset: Backblaze Drive Stats — daily hard-drive health snapshots from Backblaze's datacenter fleet, published quarterly since 2013, hundreds of thousands of drives (reported at 350,000+ in 2026). Free to download from Backblaze's Drive Stats page. Columns: date, serial number, drive model, failure flag, and raw/normalized SMART attribute readings per drive-day. Failures are rare (~1.5% annualized failure rate), making this an imbalanced binary classification problem.
- Task: Binary classification (failed vs healthy); input = one drive-day feature vector (SMART 5 Reallocated Sectors Count, 187 Reported Uncorrectable Errors, 188 Command Timeout, 197 Current Pending Sector Count, 198 Uncorrectable Sector Count, power-on hours, temperature); output = failure probability.
- Model: Random Forest classifier with class weights to handle imbalance; inputs are per-drive feature vectors, predictions are failure probabilities; decision threshold is configurable and its precision–recall trade-off is analyzed in the report.
- Metrics: ROC-AUC (design target ~0.88), F1-score, precision and recall at the chosen threshold, confusion matrix on the hold-out set. Design targets only — the report documents the actual achieved figures after the training run for the order. No accuracy is claimed as measured until the model is trained.
Delivery information
Built-to-order project. Delivery timeline is shared after order confirmation based on current queue.
Support terms
Complete documentation, setup guide, and viva preparation included. Support for setup and explanation provided.
Download free synopsis (PDF)
Enter your name and email — the synopsis PDF downloads immediately. We may send occasional project updates; no spam, unsubscribe anytime.