
More project photos (2)
The problem
Blood Pressure Log is an Android app for people who already own a blood pressure cuff and want a record of their readings. The user types in each measurement — systolic pressure, diastolic pressure and pulse — exactly as shown on their own cuff device, together with the date and time and an optional note such as "after morning walk", and the app stores the entry on the phone. Over days and weeks, the readings appear as a list and as a chart of systolic and diastolic values against time, with each entry flagged against common reference bands so unusual values stand out at a glance. Averages are shown separately for morning and evening readings, and the user can export a printable summary — overall averages, the highest and lowest readings, and the full list — to take to a doctor's appointment. The app never measures blood pressure itself: it only records, organises and presents numbers the user enters.
User's own blood pressure cuff shows systolic, diastolic and pulse values.
Follow the working sequence
How it works
The app works end to end as a manual log: the user reads the numbers off their own cuff device, types them into the app, and the app takes over from there. Each entry is validated, stored in a local database on the phone, and immediately reflected in three places — the reading list, the trend chart and the report view. Flags are computed from the stored values at display time, so correcting a reading automatically corrects its flag, its position on the chart and every average it feeds into. Averages are grouped by the morning/evening slot recorded with each entry, which keeps the two halves of the day distinct. When the user opens the doctor report, the app aggregates the stored readings into a summary and hands it to the Android print framework, which produces the printable document. No account, server or internet connection is involved at any step.
- The user measures their blood pressure with their own cuff device and opens the app.
- The user taps Add reading and enters systolic pressure, diastolic pressure, pulse, date and time, the morning/evening slot and an optional note.
- The app validates the entry — rejecting empty fields and values outside the accepted ranges — before saving anything.
- The validated entry is stored in the local Room database on the phone, with no account or server involved.
- The reading list refreshes newest-first, and the entry's category flag is computed from its systolic and diastolic values.
- The chart re-plots with the new point in chronological order, keeping morning and evening readings as separate points.
- Morning, evening and overall averages are recomputed from the stored readings.
- The user opens the Doctor Report view, reviews the summary, and prints it or saves it as a PDF through the Android print framework.
Tech stack:
- Kotlin
- Android Studio
- Jetpack Compose
- Room database
- Material Design 3
- MPAndroidChart · charting library
- Android Print framework
- Git
| Parameter | Value |
|---|---|
| Platform | Android 8.0 (API level 26) or higher (design target) |
| Language | Kotlin |
| Storage | Local on-device Room database, no account required |
| Reading fields | Systolic and diastolic pressure (mmHg), pulse (bpm), date and time, morning/evening slot, optional note |
| Input validation ranges | Systolic 50–300 mmHg, diastolic 30–200 mmHg, pulse 30–220 bpm (design target) |
| Chart | 1 plotted point per reading, in chronological order, with a 120 mmHg reference line |
| Reference bands | Normal, Elevated, High Stage 1, High Stage 2, Low (guidance only, not a diagnosis) |
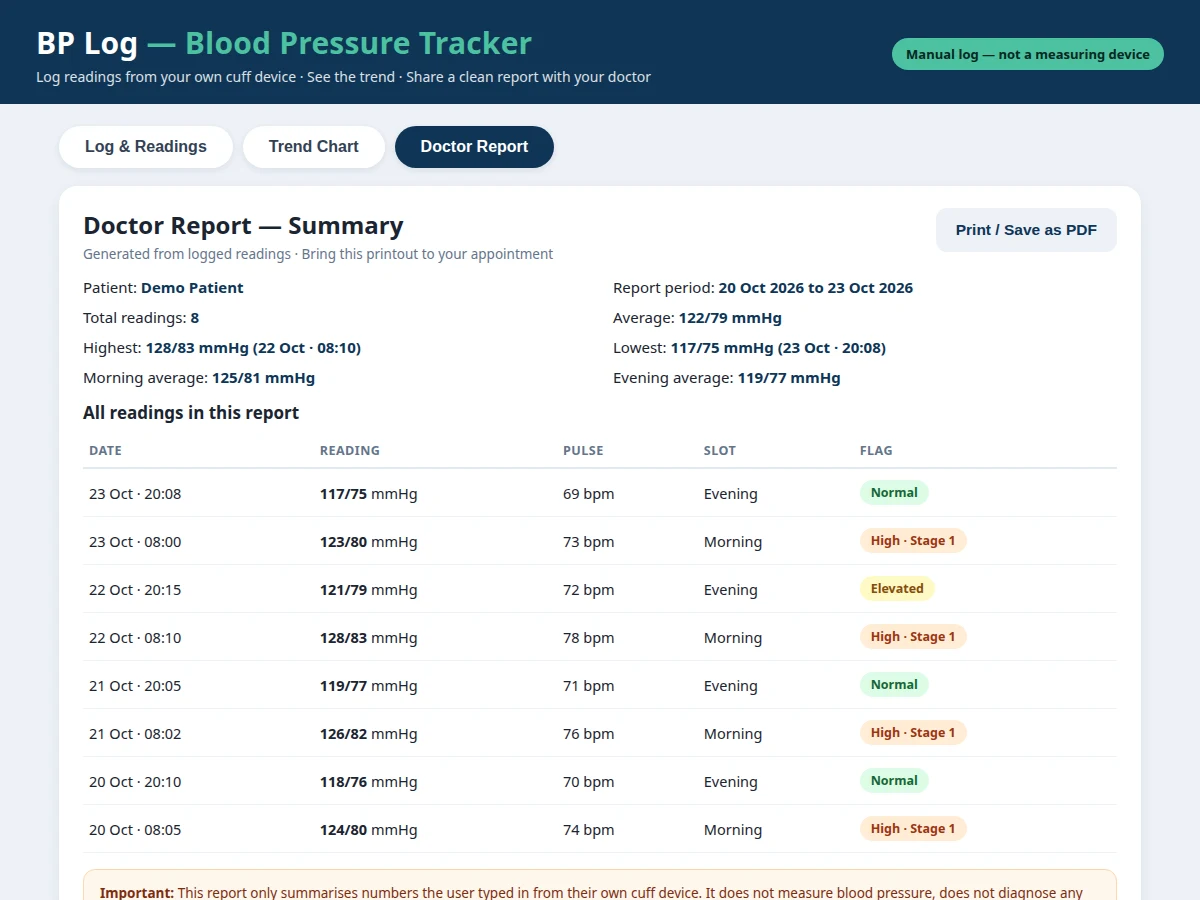
| Report contents | Overall average, morning average, evening average, highest reading, lowest reading, full reading list |
| Export | Printable report via the Android print framework, saveable as a PDF through system print |
| Connectivity | None required; the app works fully offline |
| App size | Approximately 15 MB (expected) |
Project features
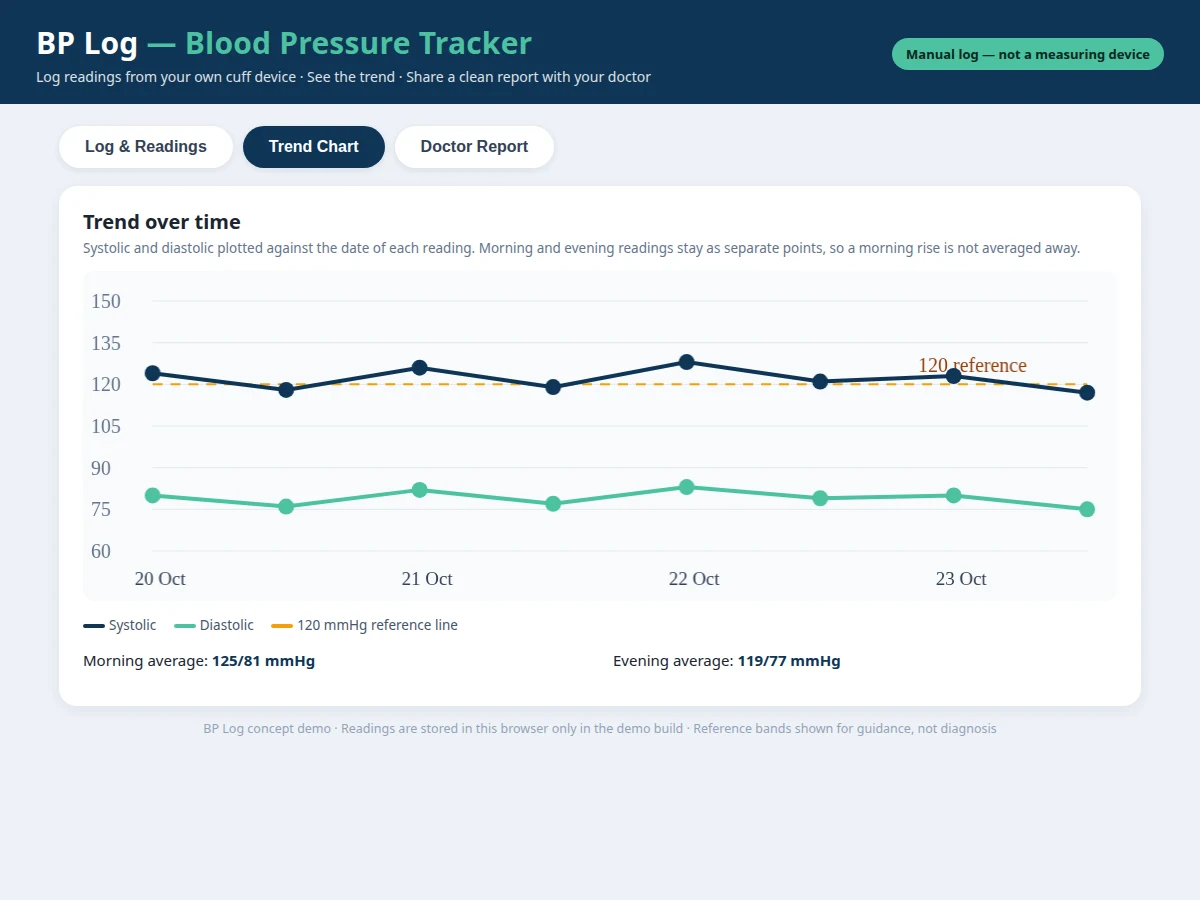
Blood Pressure Log gives the user four core capabilities: fast, validated entry of readings from their own cuff device; a searchable, editable history of every reading; a chart that shows systolic and diastolic trends over time; and a printable doctor report that summarises the whole record. Category flags sit on top of every entry so unusual values are visible without opening each record, and morning and evening averages are kept separate because a single daily average hides the difference between the two halves of the day. Everything is stored locally on the phone, so the log works without an account and without an internet connection. Optional additions and future improvements are labelled as such below, and are never described as part of the base build. Builder note from the demo build: plotting every reading on one daily average hid the gap between morning and evening values in the sample week, so the chart keeps the two slots as separate points.
- [Reading entry with validation] (Implemented) The user enters systolic pressure, diastolic pressure, pulse, date and time, a morning/evening slot and an optional note; the app rejects empty or out-of-range values before anything is saved.
- [Editable reading history] (Implemented) Every reading appears in a newest-first list with its flag and note, and any entry can be corrected or deleted when a value was typed in wrong.
- [Readings chart over time] (Implemented) Systolic and diastolic values are plotted as two lines against the date of each reading, with a 120 mmHg reference line, so trends across weeks are visible at a glance.
- [Category flagging] (Implemented) Each reading is flagged against common reference bands — Normal, Elevated, High Stage 1, High Stage 2 and Low — purely as a visual guide, never as a diagnosis.
- [Morning and evening averages] (Implemented) Averages are computed separately for morning and evening readings, so a morning rise is not averaged away by lower evening values.
- [Doctor report export] (Implemented) A summary view collects the overall average, morning and evening averages, highest and lowest readings and the full list, and exports it through the Android print framework for printing or saving as a PDF.
- [Measurement reminders] (Optional customization) Daily reminders to take a reading can be added on request; reminders are not part of the base build.
- [Cloud backup and sync] (Future scope) Backing up the log to the cloud and syncing it across devices is a possible later improvement, not included in the base build.
What is included
- Complete Android app source code (Kotlin, Jetpack Compose, Room)
- Working demo build with sample readings for testing
- Setup and build instructions for Android Studio
- Project report PDF (background, design, implementation, testing, limitations)
- PPT presentation for final review
- Viva Q&A preparation document (Android components, Room, charting, print framework)
Limitations & prerequisites
- The app does NOT measure blood pressure: it only records numbers the user types in from their own cuff device, and it is not a medical device or a substitute for certified medical equipment or professional medical advice.
- The record is only as good as the entries: a mistyped value, or a reading taken with a faulty or uncalibrated cuff, appears in the log, chart and report exactly as entered.
- Category flags follow common reference bands and are a visual guide only; they do not diagnose any condition and must never be presented as medical advice.
- The base build stores data only on the phone: if the phone is lost or reset without a backup, the log is lost, because cloud backup is future scope, not included.
- Measurement reminders are an optional customization and are not part of the base build.
- The doctor report is a summary of user-entered data, not a clinical document, and a doctor will still rely on their own measurements and judgement.
Frequently Asked Questions
Does this app measure blood pressure?
No — this app does not measure blood pressure, because it has no sensor, no cuff connection and no measurement hardware of its own; it only stores, charts, flags and reports the systolic, diastolic and pulse numbers the user reads off their own separate cuff device and types in by hand. The user measures with their own cuff, then enters the numbers; the app never produces a measurement itself.
What does the doctor report contain?
The doctor report contains the overall average, the separate morning and evening averages, the highest and lowest readings with their dates, and the complete list of readings with their category flags, so a doctor can see the whole pattern at a glance instead of scrolling through a phone. It is printed or saved as a PDF through the Android print framework, giving the user a tidy one-document summary to hand over at an appointment.
Does the app work without internet?
Yes — the app works fully offline, because every reading is stored in a local Room database on the phone itself, with no account to create, no server to reach and no data sent anywhere at any point during normal use. The only step that goes beyond the phone is printing or saving the report, which uses the phone's own print framework.
Can a reading be edited or deleted?
Yes — any reading can be edited to correct a mistyped value or deleted entirely, and the change flows through the whole app immediately, because flags, chart points and averages are all recomputed from the stored readings at display time, so one correction updates its flag, its chart position and every average it contributed to. There is no stale copy left behind to confuse the record.
Can this project be customized?
Yes — realistic customizations include measurement reminders, extra entry fields such as weight or medication notes, a different visual theme, and cloud backup for the log; each of these is built as an addition to the base app, so nothing optional is ever presented as already included in the listing above. The base build stays exactly as described, and additions are scoped separately.
Is this project suitable for a final-year project?
Yes, for Android app development and Computer Science programmes, because it demonstrates a complete mobile-app pipeline from user interface to local storage, charting and document export; students work with Jetpack Compose, Room persistence, a charting library, input validation and the Android print framework, all inside one genuinely useful health-logging concept.
Components & software requirements
- Kotlin
- Android Studio
- Jetpack Compose
- Room database
- Material Design 3
- MPAndroidChart · charting library
- Android Print framework
- Git
Delivery information
Built-to-order project. Delivery timeline is shared after order confirmation based on current queue.
Support terms
Complete documentation, setup guide, and viva preparation included. Support for setup and explanation provided.
Download free synopsis (PDF)
Enter your name and WhatsApp number — the synopsis PDF downloads immediately. We may send occasional project updates on WhatsApp; no spam.