
More project photos (2)
The problem
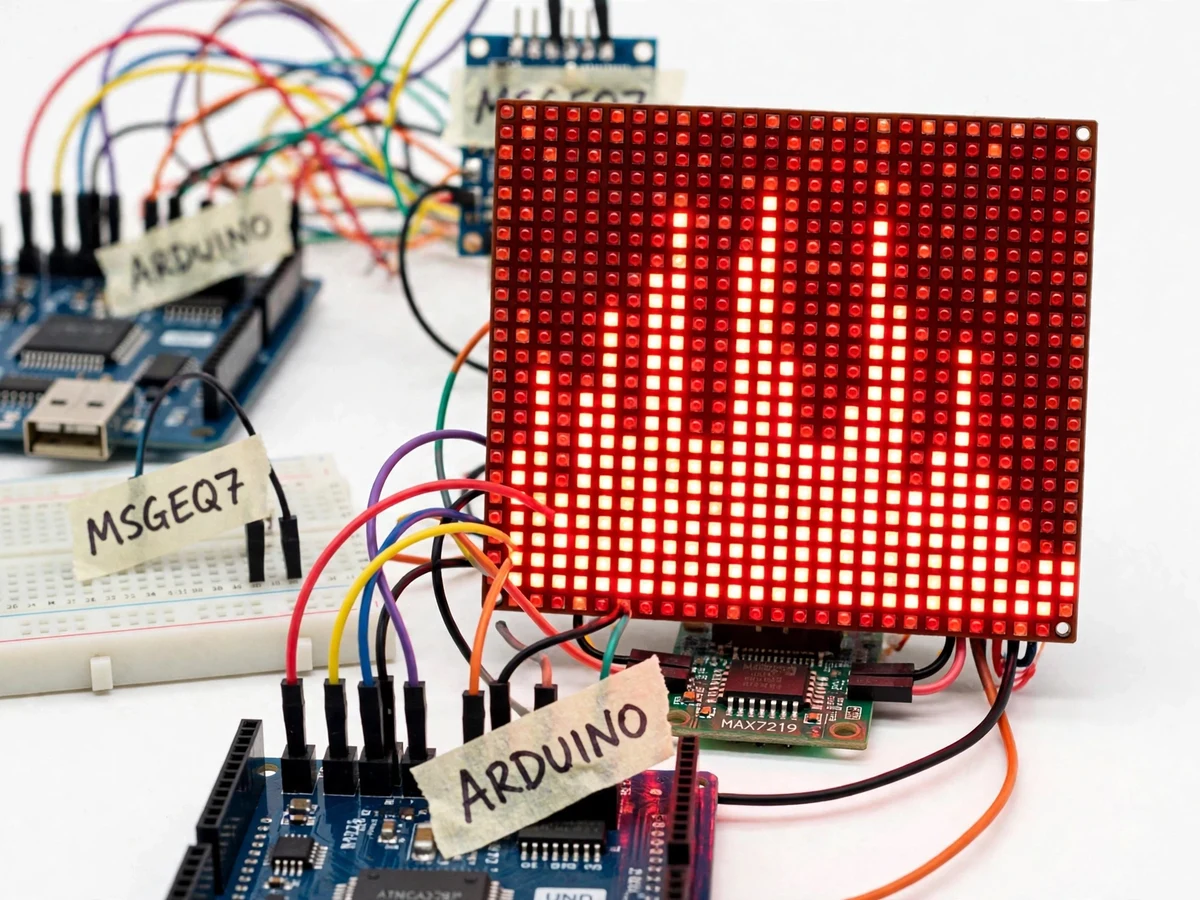
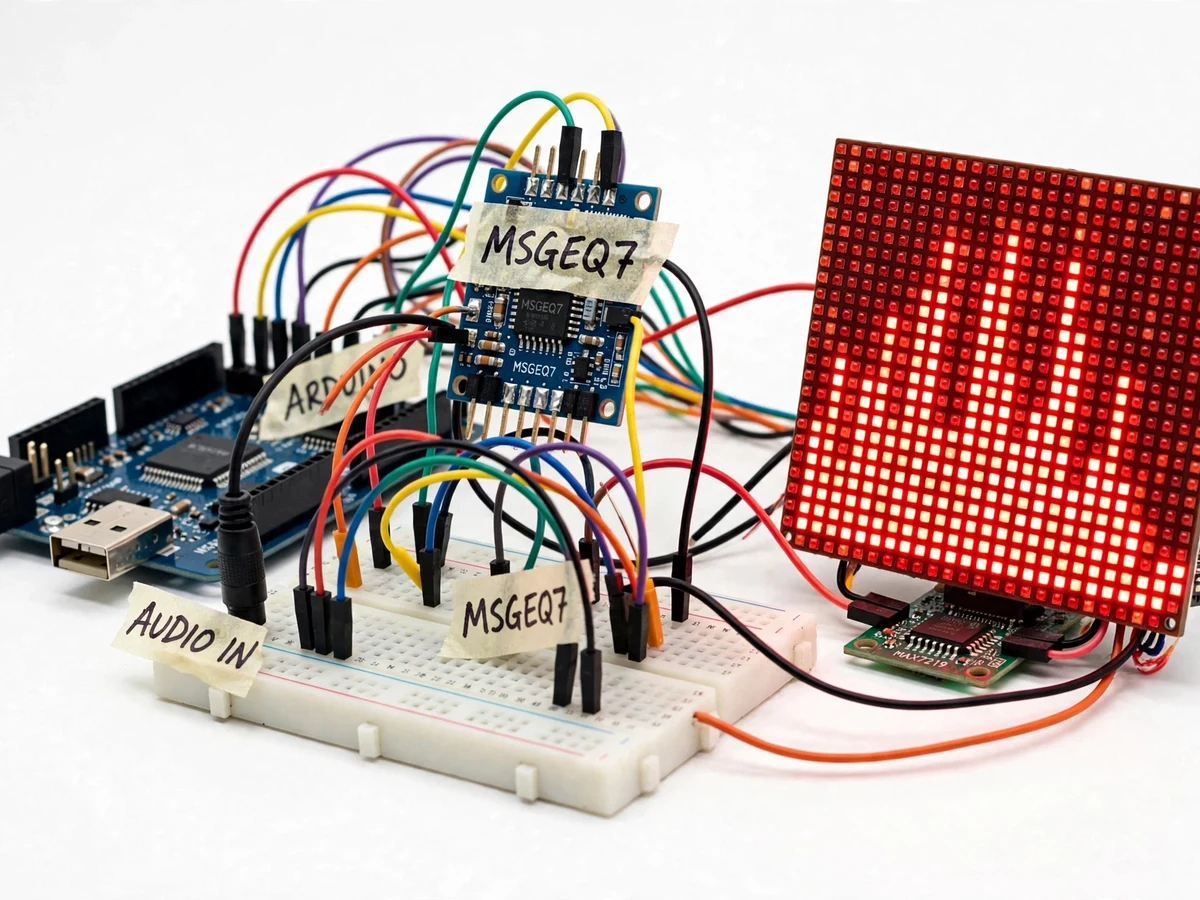
Seeing sound as frequency bars is something every electronics student recognizes from media players, yet most classroom treatments of spectrum analysis stay trapped in theory or FFT code running on a laptop. Students rarely get to touch the full analog signal chain — conditioning a real audio signal, splitting it into bands, and turning those voltages into a live physical display. The MSGEQ7 fills exactly this gap: a single CMOS chip that performs seven-channel band-pass filtering in hardware, handing the microcontroller seven DC voltages that directly represent energy at 63 Hz, 160 Hz, 400 Hz, 1 kHz, 2.5 kHz, 6.25 kHz and 16 kHz. This project pairs the MSGEQ7 with an Arduino Uno for the multiplexed readout and cascaded MAX7219 LED-matrix modules for the bar display, fed from any phone or laptop through a 3.5mm aux jack. The result is a breadboard prototype whose every node can be probed with a multimeter or oscilloscope, making the analog-to-digital journey visible and defensible in a viva.
How it works
- Audio from the 3.5mm jack passes through a DC-bias network that centers it for the MSGEQ7's input stage, with a trimmer potentiometer setting the sensitivity.
- The MSGEQ7 splits the signal into seven band-pass channels (63 Hz, 160 Hz, 400 Hz, 1 kHz, 2.5 kHz, 6.25 kHz, 16 kHz) entirely in hardware — one IC, no digital filtering.
- The Arduino pulses the RESET pin to start a cycle, then sends seven STROBE pulses; after each strobe the DC voltage for that band appears on the MSGEQ7 OUT pin.
- The firmware samples each band with analogRead, applies a configurable gain and running-average smoothing, and scales the value to 0–8 LED rows.
- Bar heights and peak-hold markers are written over SPI to the cascaded MAX7219 drivers, which refresh the matrix continuously at a design-target frame rate of roughly 30–50 Hz.
- The cycle repeats for as long as audio plays; input gain and decay speed can be retuned live from the breadboard and firmware constants.
Tech stack:
- Arduino Uno (ATmega328P), programmed in Embedded C/C++ via Arduino IDE
- MSGEQ7 7-band graphic equalizer IC (hardware band-pass filter bank)
- MAX7219 LED-matrix drivers over SPI, four cascaded 8x8 modules (32x8 display)
- 3.5mm audio input jack with DC-bias conditioning network
- Breadboard, jumper wires and trimmer potentiometer prototype
- 5V USB power supply
| Parameter | Value |
|---|---|
| Controller | Arduino Uno (ATmega328P, 16 MHz) |
| Analyzer IC | MSGEQ7 (7-channel, datasheet bands below) |
| Frequency bands | 63 Hz, 160 Hz, 400 Hz, 1 kHz, 2.5 kHz, 6.25 kHz, 16 kHz (MSGEQ7 datasheet) |
| Display | 4x cascaded 8x8 LED matrix, 32 columns x 8 rows, red LEDs |
| Display driver | MAX7219 over SPI, software brightness control (intensity register) |
| Input | 3.5mm aux, line-level audio (approximately 0.5–2 V peak typical sources) |
| Power | 5 V USB, expected draw approximately 0.5–1 A with all LEDs lit (design target) |
| Readout cycle | 7 strobes per frame; frame refresh approximately 30–50 Hz (design target) |
| Bar resolution | 8 amplitude steps per band + peak-hold marker |
| Sensitivity | Trimmer potentiometer, adjustable live |
| Build style | Solderless breadboard prototype |
Project features
- [True 7-band hardware spectrum analysis] The MSGEQ7 performs seven parallel band-pass filters in silicon — 63 Hz, 160 Hz, 400 Hz, 1 kHz, 2.5 kHz, 6.25 kHz, 16 kHz — so there is no FFT code, no DSP library and no CPU-heavy math on the Arduino.
- [Wide LED-matrix bar display] Four cascaded 8x8 LED modules driven by MAX7219 chips form a 32-column display; seven bars map to the seven bands with individual peak-hold dots that linger and fall.
- [Arduino readout firmware] The firmware pulses the MSGEQ7 RESET and STROBE lines, reads each band's DC output with analogRead, applies gain and smoothing, and pushes the bars over SPI to the MAX7219 drivers.
- [Standard 3.5mm aux input] Works with any phone, laptop or headphone jack; a DC-bias resistor network on the breadboard centers the audio around the MSGEQ7's input requirements.
- [Peak-hold and decay effects] Each bar carries a falling peak marker whose decay speed is adjustable in the firmware, giving the classic graphic-equalizer feel with tunable dynamics.
- [Probe-friendly breadboard build] Every signal — audio input, MSGEQ7 output, strobe timing, SPI lines — is exposed on the breadboard for multimeter or oscilloscope probing, which makes viva demonstrations unusually convincing.
- [Adjustable sensitivity] A trimmer potentiometer sets input gain on the fly, so the display can be tuned for quiet phone outputs or loud line-level sources without re-uploading code.
What is included
- Working breadboard prototype (Arduino Uno, MSGEQ7 breakout, cascaded LED-matrix display, audio input wiring)
- Arduino firmware source code with commented strobe-readout and display routines
- Wiring diagram and breadboard layout documentation
- Component list with part references
- Test and calibration procedure (gain setting, band-by-band signal tracing with a tone source)
- Project report PDF (background, MSGEQ7 theory, circuit design, methodology, observations)
- PPT presentation for final review
- Viva Q&A preparation document (filters, multiplexed readout, SPI, MAX7219 driving, op-amp-free conditioning)
Limitations & prerequisites
- The MSGEQ7's seven bands are fixed by the chip — this is not a fine-resolution FFT; closely spaced tones fall in the same band by design.
- Bar heights are relative levels, not calibrated dB values; the prototype is a visualizer, not a measurement instrument.
- Line-level input only — a microphone needs an added preamplifier stage (offered as customization, not in the base build).
- Breadboard wiring picks up mains hum and noise on quiet sources; clean grounding and short leads matter.
- Display is single-colour red; RGB or multi-colour matrices need different driver hardware.
- LED brightness and total current draw vary with content; a weak USB port can dim the display at full brightness.
- The MSGEQ7 output carries a small DC offset that drifts with temperature, so gain/smoothing constants are tuned per build during calibration.
Frequently Asked Questions
Which controller is used?
An Arduino Uno (ATmega328P). The readout is plain Embedded C using digitalWrite/analogRead and the SPI peripheral — no libraries doing hidden magic, so every timing detail is explainable in a viva.
Can the frequency bands be changed?
No — the seven bands are fixed inside the MSGEQ7 silicon. The project demonstrates hardware filtering; if finer resolution is wanted, a microcontroller FFT variant can be discussed as customization.
Can it work with a microphone instead of aux input?
Not as shipped — microphone signals are far too small for the MSGEQ7 input. A MAX4466-style preamplifier stage can be added on request as customization.
What power supply is needed?
Any 5 V USB supply or the Arduino's USB port; expected draw is roughly 0.5–1 A with many LEDs lit. Very weak USB ports may dim the matrix at full brightness.
What are the main limitations?
Fixed 7-band resolution, relative (uncalibrated) bar levels, line-level input only, and breadboard noise on quiet sources — all documented honestly in the report's limitations section.
Is this project suitable for a final-year project?
Yes — for Electronics, Electronics & Telecommunication and Electrical programs. It demonstrates analog conditioning, hardware filtering, multiplexed analog readout, embedded C timing and SPI display driving on one probe-able build. Suitable for B.E./B.Tech final-year projects in Electronics & Telecommunication and Electronics Engineering.
Components & software requirements
- Arduino Uno (ATmega328P), programmed in Embedded C/C++ via Arduino IDE
- MSGEQ7 7-band graphic equalizer IC (hardware band-pass filter bank)
- MAX7219 LED-matrix drivers over SPI, four cascaded 8x8 modules (32x8 display)
- 3.5mm audio input jack with DC-bias conditioning network
- Breadboard, jumper wires and trimmer potentiometer prototype
- 5V USB power supply
Delivery information
Built-to-order project. Delivery timeline is shared after order confirmation based on current queue.
Support terms
Complete documentation, setup guide, and viva preparation included. Support for setup and explanation provided.
Download free synopsis (PDF)
Enter your name and email — the synopsis PDF downloads immediately. We may send occasional project updates; no spam, unsubscribe anytime.