
More project photos (2)
The problem
Anyone who has edited a podcast or a video knows the problem: one clip is whisper-quiet, the next blows out the speakers, and "turning up the volume" is guesswork because peak meters don't match perceived loudness. Broadcasters solved this decades ago with loudness standards — ITU-R BS.1770 defines how to measure what humans actually hear, and platforms normalize everything to targets like −14 LUFS. But students rarely see the algorithm working; it stays buried inside expensive DAWs. This utility implements the core of the standard as a transparent desktop tool: each clip passes through K-weighting filters, is split into 400 ms blocks, gated (absolute −70, relative −10 LU), and reduced to a single integrated-loudness number plus loudness range. The required gain is then computed against a selectable target, with a true-peak check that engages a limiter at −1.0 dBTP if the gain would clip. Before/after waveforms, per-clip meters and a batch queue make the whole pipeline visible and demonstrable.
How it works
- The utility loads each audio clip (WAV/PCM) into memory at its native sample rate.
- A K-weighting filter chain (high-shelf plus high-pass stage, per BS.1770) is applied to approximate human hearing sensitivity.
- The filtered signal is split into 400 ms blocks with 75% overlap, and each block's mean-square energy is computed.
- Blocks below the −70 LUFS absolute gate are discarded; the relative gate (−10 LU below the ungated mean) removes quiet passages from the average.
- The gated mean converts to a single integrated-loudness value in LUFS, and the block distribution yields the loudness range (LRA).
- Required gain = target LUFS − measured LUFS; the true peak after gain is estimated and a limiter is applied if it would exceed −1.0 dBTP.
- The gain (and limiting, if any) is written to the output file, and the batch queue processes the remaining clips the same way.
Tech stack:
- Python 3 · NumPy/SciPy (DSP)
- PyQt / Tkinter desktop UI
- ITU-R BS.1770 loudness algorithm
- WAV I/O · Web Audio demo
- Matplotlib-style waveform rendering
- Single-file web demo (HTML/CSS/JS)
- Git
| Parameter | Value |
|---|---|
| Loudness standard | ITU-R BS.1770 integrated loudness (design target) |
| Block size | 400 ms with 75% overlap (design target) |
| Gates | Absolute −70 LUFS, relative −10 LU (design target) |
| Targets | −14, −16, −19, −23 LUFS presets + custom (design target) |
| True-peak ceiling | −1.0 dBTP with limiter (design target) |
| Batch | Sequential queue with progress (design target) |
| Demo | Single-file web app with synthesized clips (design target) |
Project features
- [BS.1770-style loudness measurement] K-weighting filter stages, 400 ms blocks with overlap, absolute and relative gating — the standard integrated-loudness recipe, implemented transparently.
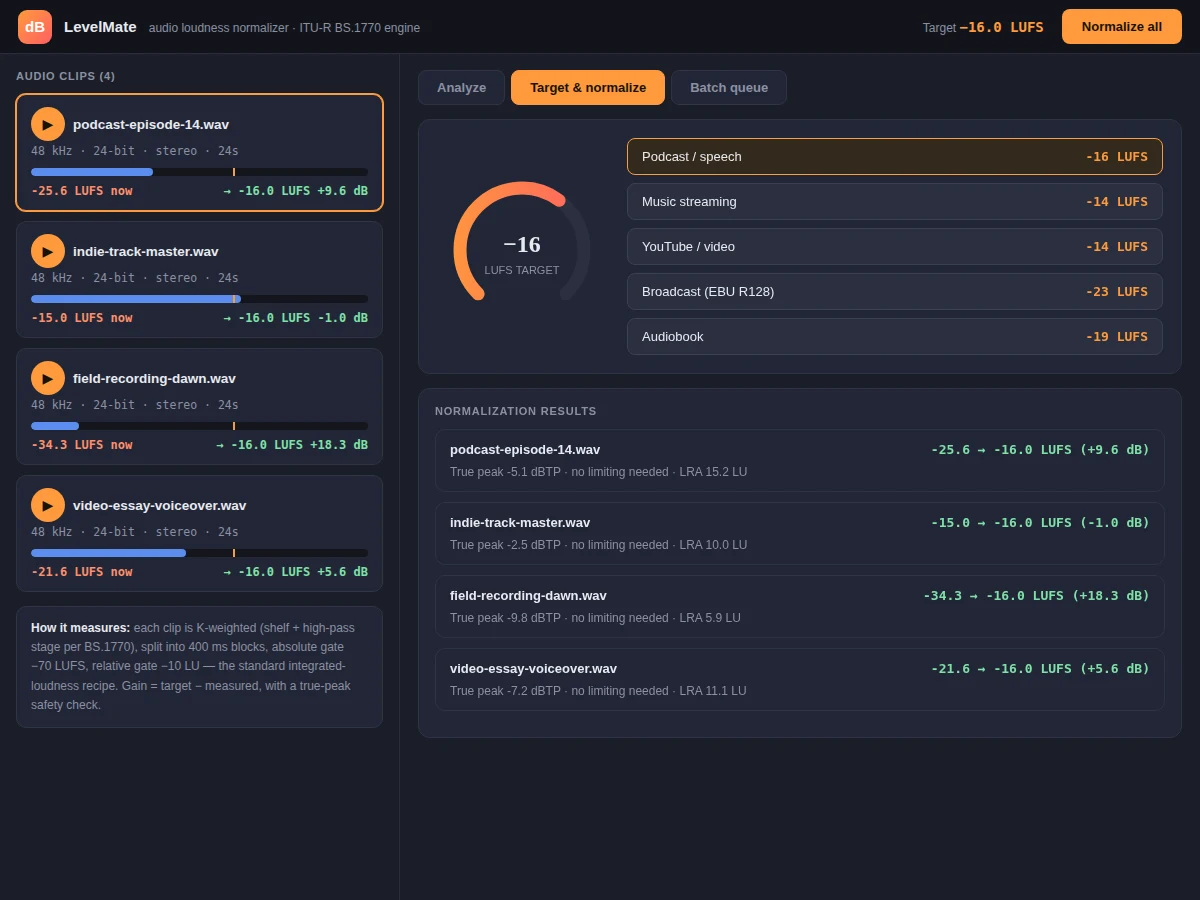
- [One-click normalization] Pick a target (−16 podcast, −14 music/streaming, −23 broadcast, −19 audiobook) and the utility computes and applies the exact gain per clip.
- [True-peak safety] After gain, the true peak is checked against a −1.0 dBTP ceiling; a limiter engages automatically when needed instead of clipping.
- [Loudness range (LRA)] The 10th–95th percentile block spread is reported per clip, showing dynamics at a glance.
- [Before/after waveforms] The original and gain-adjusted waveforms render overlaid with the true-peak ceiling marked.
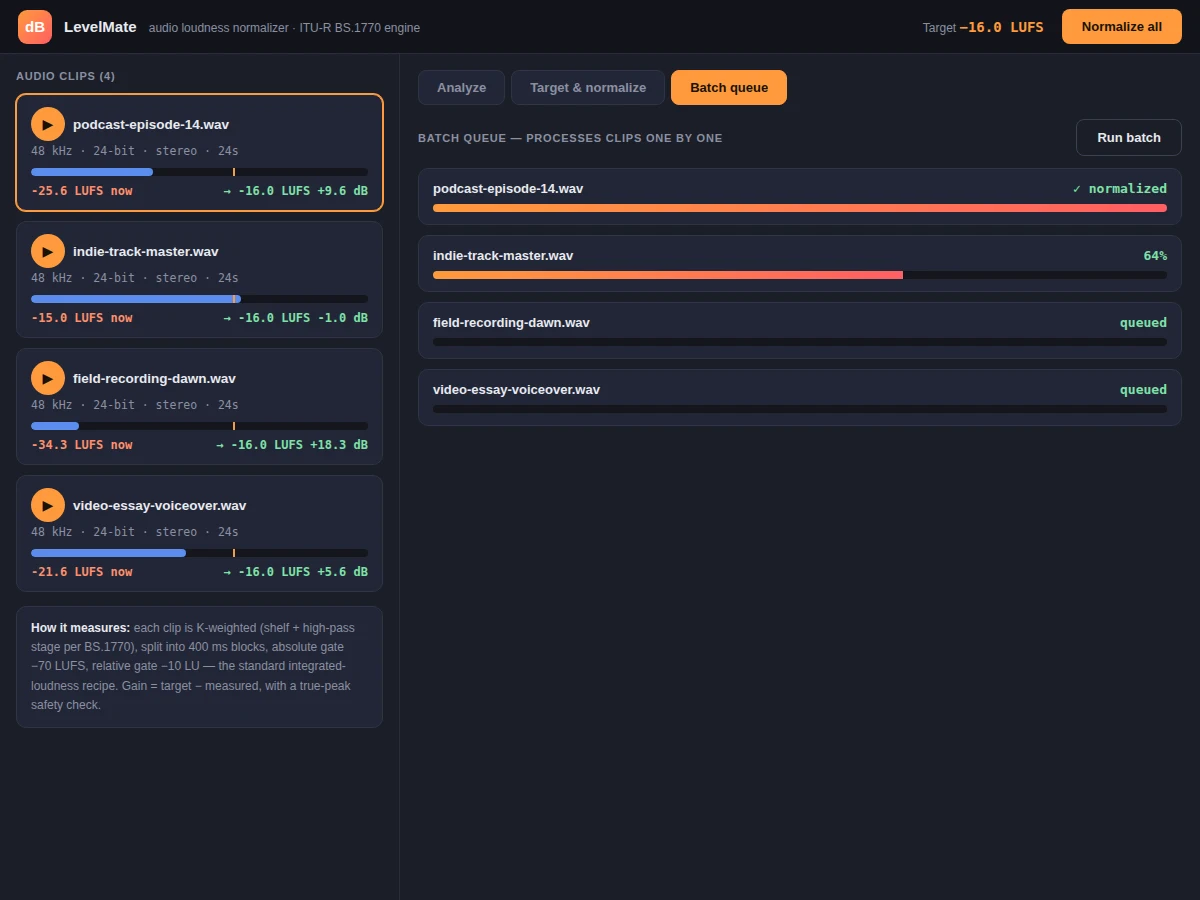
- [Batch queue] Normalize a whole folder of clips in one run with per-file progress and a results summary.
- [Audition] Play any clip with the computed gain applied, through the system audio device.
- [Per-clip meters] Every clip shows its measured LUFS against the target line before you commit.
What is included
- Complete desktop utility source code (Python)
- DSP design document (K-weighting, gating, gain/limiter math)
- Working demo with the full analysis and normalization UI
- Project report PDF (background, loudness theory, algorithm, methodology)
- PPT presentation for final review
- Viva Q&A preparation document (LUFS vs dB, gating, true peak, limiting)
Limitations & prerequisites
- The demo analyzes synthesized clips in the browser; file I/O and full-rate DSP ship in the Python application.
- Loudness figures follow the BS.1770 recipe but this is an educational implementation, not a certified broadcast meter — stated honestly in the report.
- True-peak estimation is an approximation; broadcast compliance measurement needs oversampling the report documents as future scope.
- Supported input in the shipped build is WAV/PCM; MP3/AAC decoding is listed as future scope.
Frequently Asked Questions
What is LUFS and why not just use peak volume?
LUFS (loudness units relative to full scale) measures perceived loudness using frequency weighting and gating, per ITU-R BS.1770. Two clips with the same peak level can sound wildly different in loudness — LUFS captures what listeners actually hear.
How does the measurement work?
The audio is K-weighted (mimicking hearing sensitivity), split into 400 ms blocks, quiet blocks are gated out, and the rest are averaged into one integrated number, with loudness range from the block distribution.
What stops normalization from clipping?
After computing the gain, the utility estimates the true peak; if it would exceed −1.0 dBTP, a limiter is applied at the ceiling instead of letting samples clip.
Which targets are supported?
Presets for podcast (−16), music streaming (−14), video (−14), broadcast EBU R128 (−23) and audiobook (−19), plus any custom target value.
Can it process many files at once?
Yes — the batch queue normalizes a whole folder sequentially with per-file progress and a results table.
Is this project suitable for a final-year project?
Yes — for Computer Science, IT and Electronics programs. It demonstrates digital signal processing, standards-based engineering and desktop application development. Suitable for B.E./B.Tech final-year projects in Computer Science, IT and Electronics.
Components & software requirements
- Python 3 · NumPy/SciPy (DSP)
- PyQt / Tkinter desktop UI
- ITU-R BS.1770 loudness algorithm
- WAV I/O · Web Audio demo
- Matplotlib-style waveform rendering
- Single-file web demo (HTML/CSS/JS)
- Git
Delivery information
Built-to-order project. Delivery timeline is shared after order confirmation based on current queue.
Support terms
Complete documentation, setup guide, and viva preparation included. Support for setup and explanation provided.